Sports Info Solutions
Category: John Dewan’s Stat of the Week
-
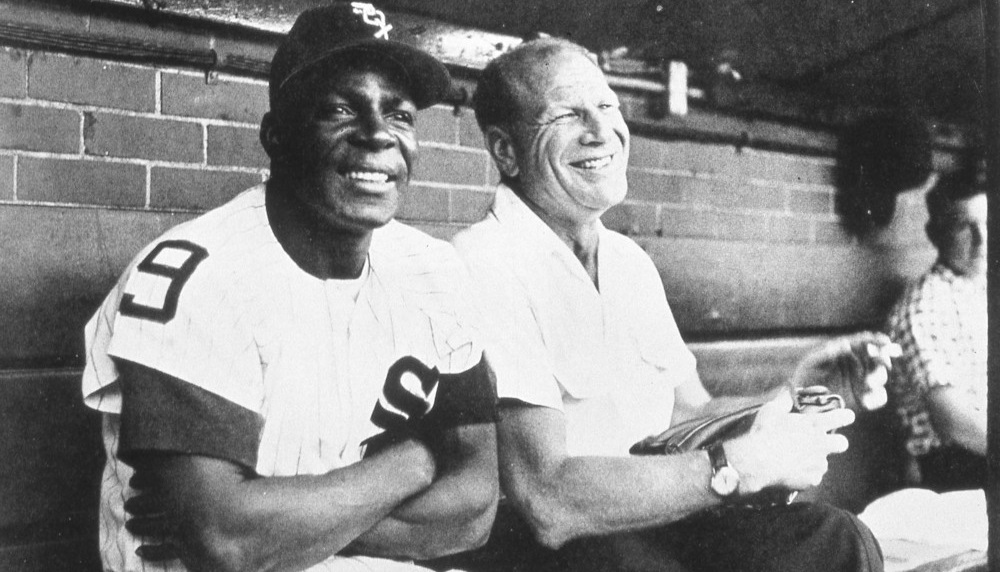
Stat of the Week: New Hall-of-Famers
By
A common thread among the Hall of Fame selections is defensive excellence.
-
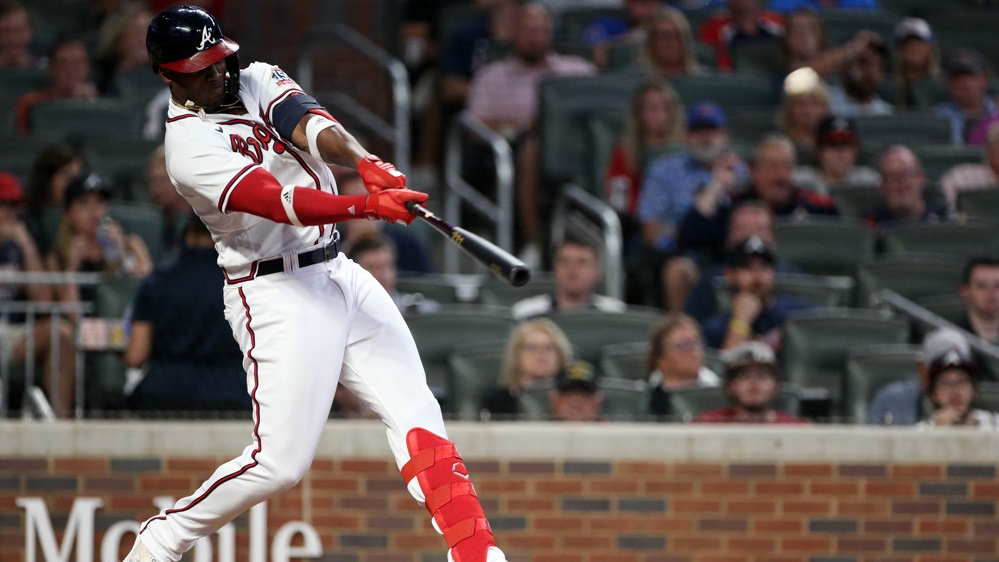
Stat of the Week: The Braves Won The Marathon
By
When we look back on the Braves, we’ll remember the improvements made by Max Fried, Jorge Soler, Tyler Matzek, and their infield defense
-

Stat of the Week: Fielding Bible Awards Preview (Part II)
By
Aaron Judge is among the headliners as we look at the candidates for top outfield defenders.
-
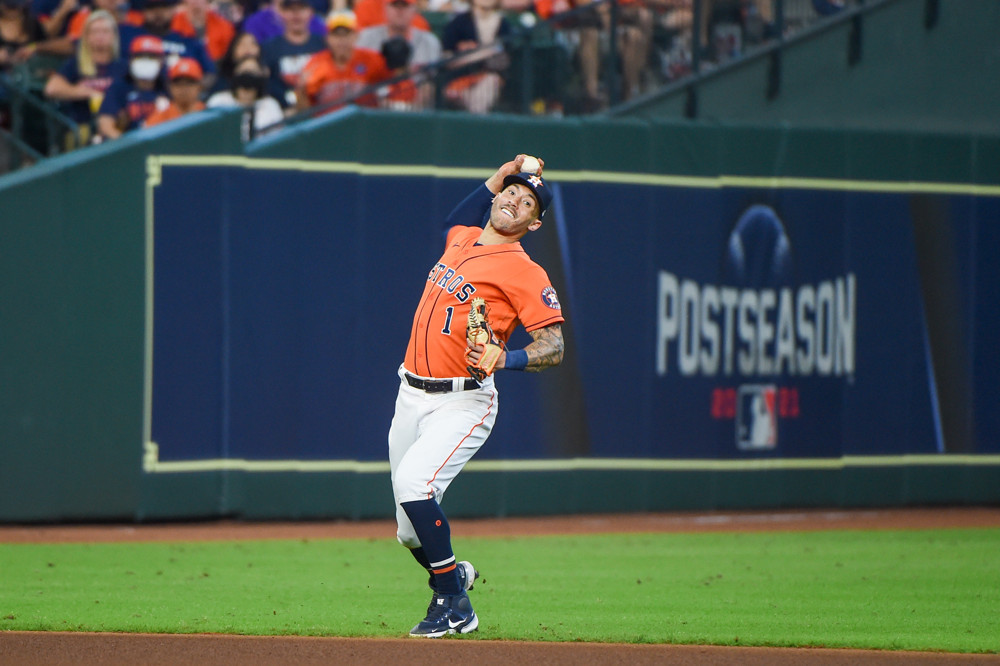
Stat of the Week: Fielding Bible Awards Preview – Part I
By
We look at which infielders could win top honors, Carlos Correa among them.
-

Stat of the Week: An Unlikely Defensive Runs Saved Champion
By
Be ready to be surprised by the team that finished atop the majors.
-

Stat of the Week: 2021 MLB Surprises
By
The Giants, Mariners, and Rays are among the most prominent ones of 2021
-

Stat of the Week: 2021 Minor League Standouts
By
If you’re not familiar with Keibert Ruiz, Michael Harris, and Aaron Ashby, you likely will be soon.
-

Stat of the Week: Cardinals Lead The Way … Again
By
The Defensive Runs Saved leaders are finishing 2021 with a flourish
-
Stat of the Week: The Fielding Bible All-Decade Team
By
Which players were best in the field from 2010 to 2019?
-
Stat of the Week: Walker, Rolen, Abreu & Hall of Fame Worthiness
By
By Mark Simon This year’s BBWAA Hall of Fame ballot is headlined by Yankees shortstop Derek Jeter and understandably so, given his excellence in both the regular season and postseason, and his longevity. Jeter is a lock for election, perhaps even joining Mariano Rivera in receiving unanimous support. In the 2019 Bill James Handbook, Bill…