By ANDREW KYNE
Aaron Nola was one of baseball’s best pitchers in 2018, but currently has a 6.84 ERA and 6.05 FIP through five starts in 2019. His walk rate, which sat around 6 to 7 percent in his first few seasons, is currently north of 10 percent.
After his April 15th start against the Mets, Nola’s manager Gabe Kapler said the following (via MLB.com):
“I’m concerned about his command. His command is his calling card. He’s got movement, deception, life, and those things are still there. He just needs to put the ball where he wants to throw it.”
As part of our pitch charting operation at Baseball Info Solutions, we chart not only the location of the pitch, but also the location of the catcher’s mitt. Comparing the distance between the pitch location and mitt location gives us, on average, a pretty good proxy for a pitcher’s command.
For the entire league, we take all of those distances from the mitt and divide pitches into four buckets, based on percentiles:
- Closest to Mitt (25th percentile and lower)
- Close to Mitt (26th to 50th percentile)
- Far from Mitt (51st to 75th percentile)
- Farthest from Mitt (76th percentile and higher)
Some of the leaders in 2018 in throwing close to the catcher’s target (combining the Closest to Mitt + Close to Mitt buckets) were names you would probably expect: Dallas Keuchel, Kyle Hendricks, Zack Greinke, etc.
Nola was pretty good, too. Among the 100 pitchers who threw the most innings last year, Nola ranked 18th in “close percentage” (Closest to Mitt + Close to Mitt).
This year, however? Among the 100 pitchers who have thrown the most innings so far, Nola ranks 75th in close percentage.
Here’s a look at his distribution of pitches in terms of proximity to the catcher’s target, using those league-wide percentile buckets:
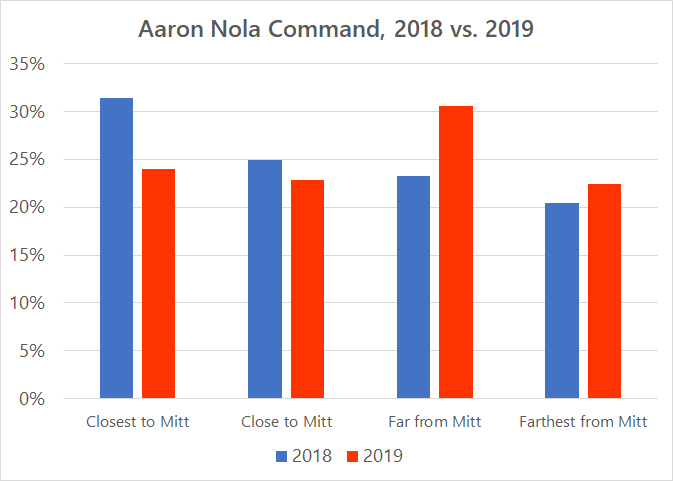
| Season | Closest | Close | Far | Farthest |
| 2018 | 31% | 25% | 23% | 21% |
| 2019 | 24% | 23% | 31% | 22% |
Last year, 31 percent of Nola’s pitches were in the Closest to Mitt category, but that percentage is down to 24 percent so far this year. Additionally, he’s seen a big jump in the Far from Mitt pitches (those that fall in the 51st to 75th percentile across the league).
That said, Nola’s start against Colorado on Saturday may have been a step in the right direction. He struck out nine and walked only one, and the command numbers were much better than his previous outings:
| Date | Closest | Close | Far | Farthest |
| 3/28 (ATL) | 19% | 21% | 39% | 20% |
| 4/3 (WSH) | 29% | 18% | 25% | 29% |
| 4/9 (WSH) | 19% | 28% | 28% | 24% |
| 4/15 (NYM) | 19% | 11% | 40% | 30% |
| 4/20 (COL) | 35% | 33% | 20% | 12% |
Perhaps he’s shaking off some early season rust or still getting acclimated with his new catcher, but Nola’s command will be something to keep an eye on as the Phillies look to make a push for the NL East.