By Nate Weller
The NFL passed a rule change at its owners meetings to make pass interference a reviewable call. In light of the development, we wanted to share a newsletter that we sent to our NFL team partners earlier this year.
After what can best be described as a controversial end to the season, both pass interference (PI) and the current instant replay system are at the forefront of conversation this NFL offseason. With this in mind, SIS looked at which penalties are the most influential over the course of a game, and specifically which penalties might warrant being included in the NFL’s review process moving forward.
SIS’s charting data includes detailed information about penalties, reviews, receiver participation and route information, and was analyzed in terms of both Expected Points and actual Net Drive Points. The goal was to see both the expected and actual impact of different penalties on the game, the different factors that can drive those penalties, and how those plays compare overall to plays reviewed under current NFL rules, namely touchdowns, turnovers, and receptions.
Using Expected Points to Evaluate the Impact of Penalties
From 2016 to 2018 an offensive touchdown was worth an average of 2.03 Expected Points. While this seems low, it is worth reiterating that for a clear majority of touchdowns, most of the value comes in the plays preceding the score, as opposed to the scoring play itself. Turnovers, on the other hand, are among the most impactful events during a game, costing the offense 3.97 Expected Points on average, almost twice the value of the average touchdown.
For comparison, all accepted penalties from the last three seasons were analyzed, and the 10 most impactful penalties by EPA for each side of the ball are shown below:
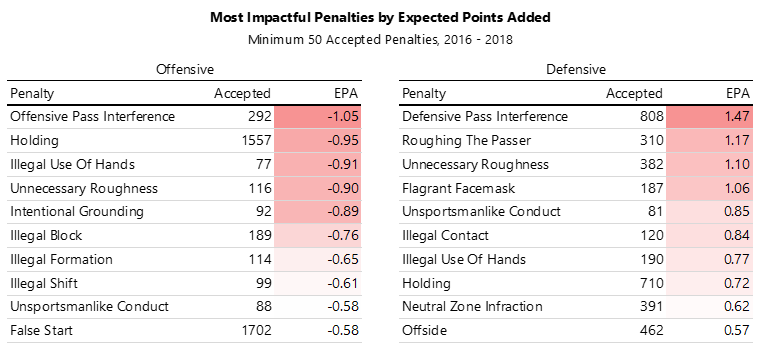
On the defensive side, pass interference is not only the most common penalty, but also the most substantial based on Expected Points. On average, defensive pass interference (DPI) nets the offense an additional 1.47 Expected Points. While this is not quite on par with a scoring play or a turnover, it outpaces the next closest defensive penalty by about a third of a point, and the most severe offensive penalty by almost half a point.
While this analysis primarily focuses on the defensive side of the ball, it is still notable that offensive pass interference (OPI) has the most severe impact of any offensive penalty with -1.05 EPA. It is called far less frequently than its defensive counterpart, but, when called can play a large role in shaping a drive or game, and it separates itself from the other more common offensive penalties.
Using Net Drive Points to Evaluate Penalties
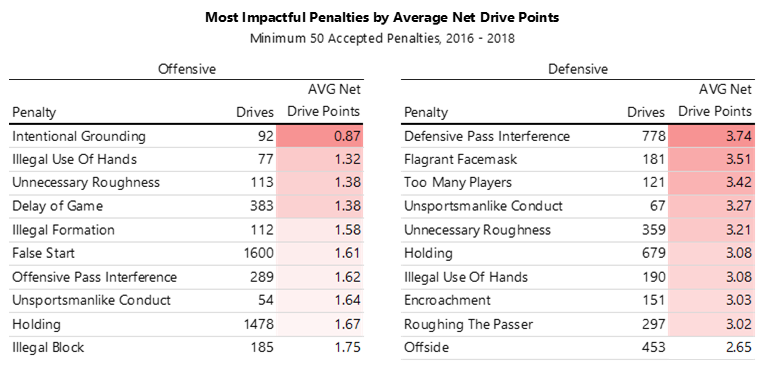
Another way to look at this data is through the lens of Net Drive Points. Net Drive Points are the eventual points scored on each drive, including negative points for defensive touchdowns. From 2016 to 2018 the average offensive drive netted 1.62 point. To quantify how much each penalty can jump-start or stall a drive, drives results were grouped by penalty type. Again, the top 10 penalties for each side of the ball are listed below:
When comparing the Net Drive Points for penalties it is important to understand the relationship between the length of drives and the likelihood of penalties.
The average drive that did not have a penalty was 4.9 plays long, compared to 8.3 for drives with a penalty. This is obviously not an indication that offensive penalties extend drives, but simply that the more plays you run, the more likely you are to take a penalty. With that in mind, the numbers for Net Drive Points are slightly inflated, but still allow us to see which penalties had the greatest impact on overall drive results.
DPI was the most drastic, adding well over two points to the average drive, and was about a quarter of a point higher than the second highest penalty. Additionally, DPI occurred on 778 unique drives in the last three seasons, more than any other defensive penalty, and was outdone only by holding and false start on the offensive side.
Comparing offensive and defensive penalties, almost all the most significant penalties occur on the defensive side of the ball. The only offensive penalty that rivaled the severity of a defensive penalty in terms of Net Drive Points was intentional grounding, which includes both a loss of yardage and a loss of down.
DPI as a Function of Play Calling
There are a few factors that drive the increased impact of defensive penalties, the strongest being that automatic first downs add a lot of value for the offense. When looking at the overall EPA of penalties by down, this becomes very clear.
The average EPA of a defensive penalty on first down is 0.64, but it doubles to 1.28 when the penalty occurs on third down. This is likely a result of large EPA swings when an offense is awarded a first down in third-and-long situations.
Further illustrating this, the impact of offensive penalties remains consistent regardless of down, with first, second, and third down having EPA values of -0.77, -0.81, and -0.75, respectively.
Most importantly, there is evidence that—at least on some level—offenses can force the defense into penalties. Specifically, targeting vertical routes leads to more PI calls.
When breaking down which routes are most likely to draw DPI, three routes stand out: hitch and go, fade, and go/fly. All three routes drew pass interference on about 7% of targets. No other route drew DPI on more than 3 percent of targets. The top 10 routes by their ability to draw DPI are shown below:
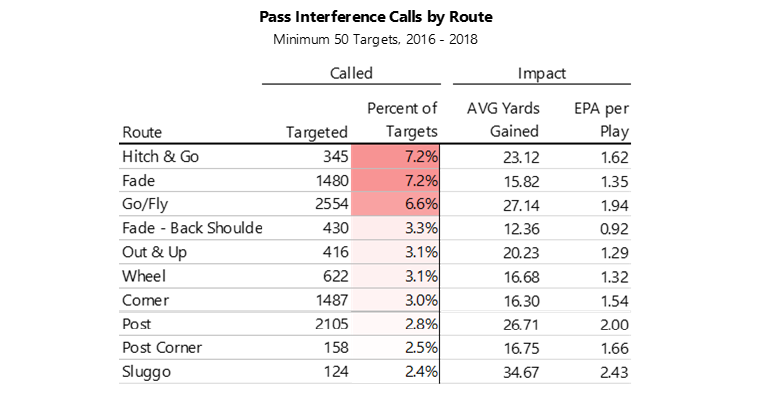
Not surprisingly, the routes that stretch the field vertically put the most stress on defenders and lead to the most pass interference calls. The average throw depth of a play with DPI is 19.7 yards, about 8 yards higher than the average reception that results in a review (11.8) and more than 10 yards higher than the average throw (8.5).
Therefore, teams that stretch the field, especially in high-leverage situations such as third downs, would also be more likely to benefit from pass interference calls.
The go/fly also stands out in terms of impact. It is not only among the most likely to draw a DPI, but it also gains an average of 27.14 yards when flagged, well over double the average reviewed catch, and has an EPA of 1.94, just shy of the average EPA of a touchdown. The post and sluggo route draw DPI less frequently but have a similar impact when called.
Final Thoughts
While DPI did not prove to be as impactful as scoring plays or turnovers by EPA, it did still stand out amongst penalties. DPI was a third of a point higher than any other penalty in terms of EPA and was also the most accepted defensive penalty. On the other side of the ball, offensive pass interference was the most impactful offensive penalty.
DPI also stood out in terms of Net Drive Points. Offenses scored an additional two points per drive on average when DPI was called. This ranked it as the most severe penalty overall, about a quarter of a point higher than the next penalty, all while occurring on the most unique drives among defensive penalties. (Only holding and false start occurred more often overall.)
Another important finding is that offenses can play a role in defensive penalties. There were three routes that stood out in their ability to draw DPI: hitch and go, fade, and go/fly.
High yardage penalties, coupled with the impact of automatic first downs can lead to large swings in games, particularly when it is called in third down situations. Pass interference warrants inclusion in the NFL’s review system. The above analysis shows that PI is at least as impactful as plays that can currently be challenged, specifically receptions, and are among the most impactful plays in the game.