By ANDREW KYNE
As noted in last month’s look at Rougned Odor’s bunting against shifts, Baseball Info Solutions charts the starting positions of infielders on groundballs and short line drives.
Combining those starting positions with batted ball information, let’s try to visualize the range of some of baseball’s best and worst defensive shortstops. We’ll focus on lateral range here (a good proxy for overall range). If a ball is hit 20 or 30 feet to a player’s left, how likely is he to field the ball? (What happens afterwards isn’t considered here; we’re just checking if it was fielded by the shortstop. How many balls can he get to?)
This requires a few steps and filtering. Here was my approach:
- Grounders measured between 1.25 and 2.00 seconds from the time it was hit to the time it was either fielded or reached the outfield grass. This gives us balls that aren’t hit too slowly (and would require an extreme charge), but also not super hard (and thus impossible to field unless perfectly positioned).
- Excluding balls fielded by other infielders. The shortstop had to have had an opportunity to make the play.
- To determine the lateral distances, I calculated the chord length between the fielder’s starting position and the path of the ball. Essentially, it’s the straight-line distance the shortstop would have to move between his starting position and the path of the ball at the same depth. Charging the ball can obviously impact this calculation/distance, but the 2.00-second cutoff is meant to limit those opportunities.
- All applicable plays since 2016 to get a large enough sample.
- For plotting, I bucketed balls in bins of 10 feet in either direction. And on the images below, negative distances are to the player’s right (into the SS/3B hole, if traditionally positioned) and positive distances are to the player’s left (up the middle).
With that said, here’s the league average distribution for these balls in play.
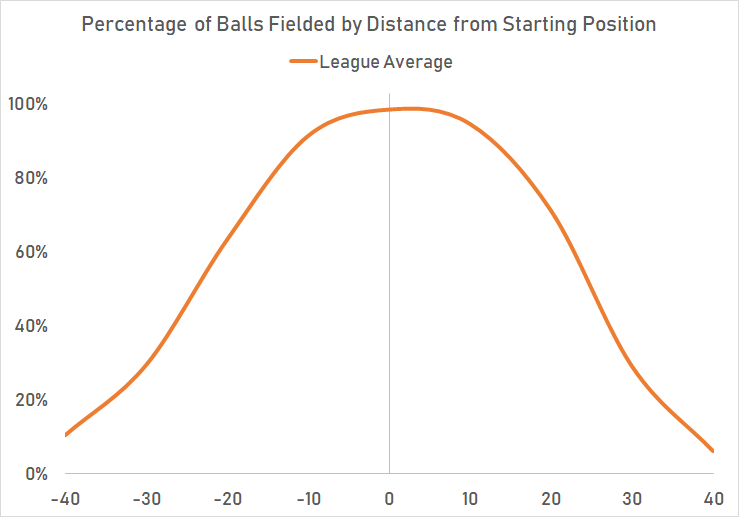
These balls in play, when hit right at the shortstop, are fielded nearly 100% of the time. Balls hit about 10 feet in either direction are still above 90%. It dips to about 60-70% at 20 feet from the starting position, then down to about 30% at 30 feet away. And around 40 feet and beyond is where the rate of being fielded drops to 10% and below.
Let’s compare that with Arizona’s Nick Ahmed, who has the most Range & Positioning Runs Saved at shortstop since the start of 2018.
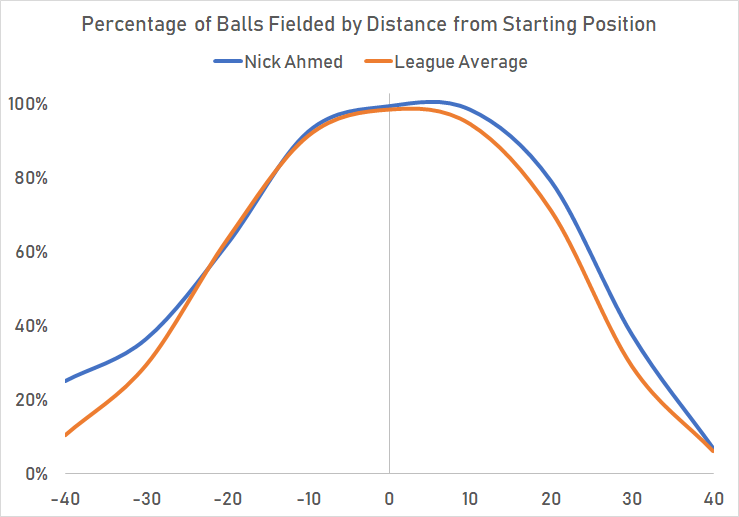
Ahmed (blue line) has been consistently above average to his left/up the middle (and can make highlight-reel plays like this one). He’s fielded a similar amount of balls as his peers going 10-20 feet to his right, but has reached more than the typical shortstop beyond that (like this one). And in addition to range, Ahmed’s arm helps separate him from other shortstops in converting outs.
How about Andrelton Simmons?
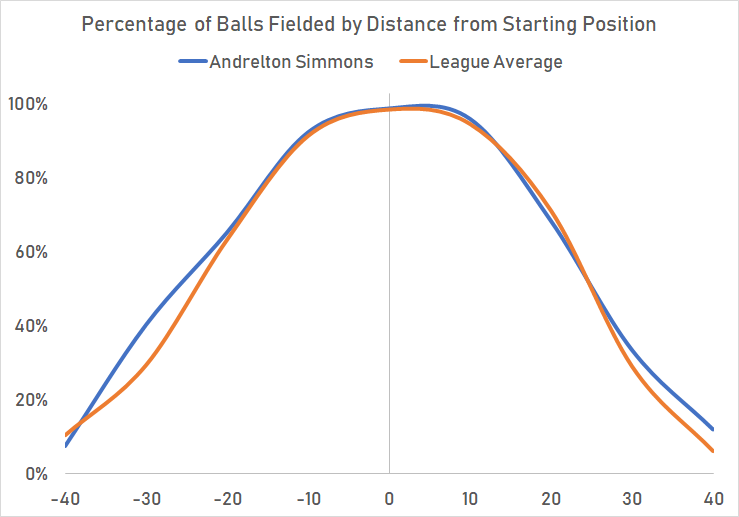
Interestingly, he tracks pretty closely with all shortstops, with the exception of a boost in the 30-foot bucket to his right. Like Ahmed, Simmons boasts a great arm to complement his range, elevating him further above other shortstops.
But instead of comparing him to all shortstops, what about comparing him to one with poor range? Here’s Simmons (blue line) versus Jordy Mercer (orange line).
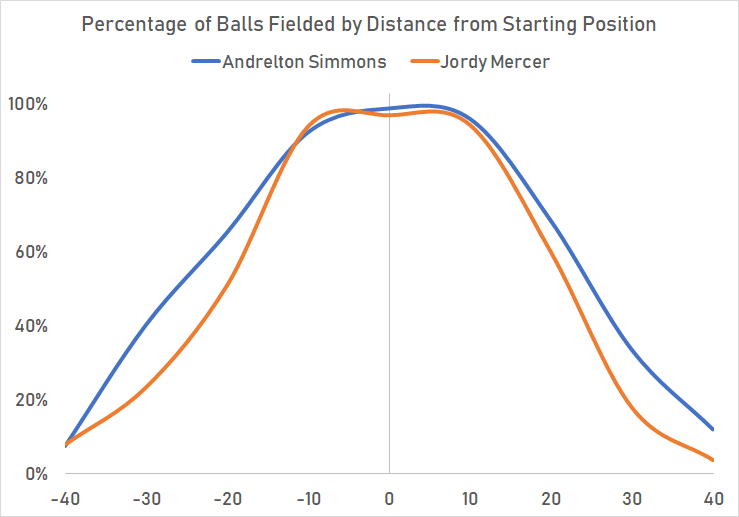
Mercer has fielded a high percentage of balls hit within 10 feet in either direction, but Simmons has been better than him beyond that. Mercer has cost his teams 25 runs by our Range & Positioning system since the start of 2016.
The only shortstop who has lost more Range & Positioning runs in that time is Boston’s Xander Bogaerts (-39). Our system has significantly penalized Bogaerts for balls hit to his right (SS/3B hole), and his limited range on those balls is confirmed here.
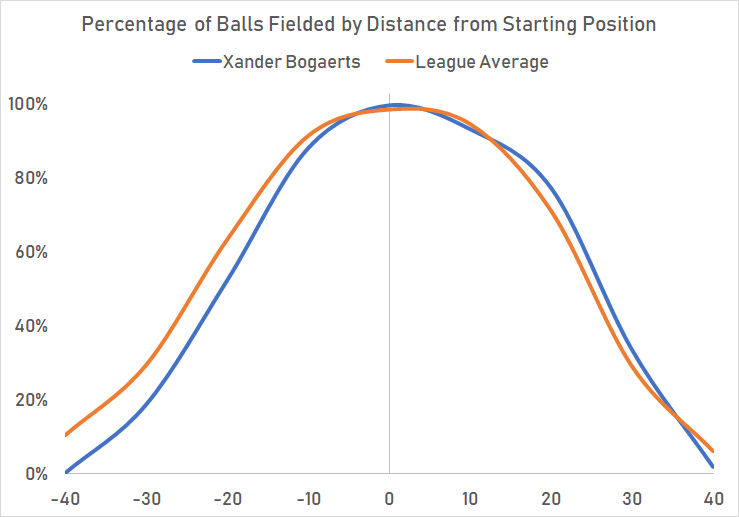
Bogaerts has been close to his peers on balls hit to his left, but well below average at reaching balls hit to his right.
The margins here are pretty small. After all, those who play shortstop — and stay there — tend to have the necessary range to reach enough batted balls in their zones. But since shortstops have a high volume of balls hit to them, those small differences can add up over the course of a season.