By COREY EIFERMAN, SIS Video Scout
Over the last nine years, I have created and adjusted a metric that is intended to be a useful tool to evaluate a hitter’s offensive season. It has undergone a few name changes, but I currently call it Offensive Expected Value (OEV). The people at SIS, where I work as a Video Scout, are allowing me to share it here. This is work that I’ve done independent of my work there and is a work-in-progress. I welcome any feedback on it.
The point of the stat is to give a player a value on their offensive output based on their at- bat results, similar to Weighted On-Base Average (wOBA). The most important difference being this: Instead of just hit types and reaching base getting different weights, out types are assigned different weights as well.
To make things a little simpler, the stat groups types of outs into bins of differing values. For example, sacrifice flies are grouped in with regular fly outs, as to not punish a player in a lineup with fewer guys who get on base to drive in from third. Hypothetically, a player on a weaker offensive team could be turning those regular fly outs into sacrifice flies. The groupings have been reconsidered every year, and I continue to look for an answer.
Another difference between it and wOBA is that the weights are looked at as “base values” instead of run values. Each valuation is supposed to match the bases their team would gain when the average base-situation was taking place. I have studied Run Expectancy tables to try to find what the proceeding, semi-arbitrary weight valuations should be. For 2019, here is how each category was laid out:
| Home Runs | 6.68 |
| Triples | 4 |
| Doubles | 3.52 |
| Singles | 1.48 |
| Walks + HBP | 1.12 |
| Reached on error + Catcher Interference | 0.52 |
| “OOuts” (Including Sac Flies & Fly Outs) | 0.17 |
| “IOuts” (Including Fielder’s Choices and Sac Bunts) | 0.09 |
| “SOuts” (Infield Pop Ups & Lineouts + Strikeouts) | 0 |
| “MOuts” (Double Plays & Triple Plays) | -0.1925 |
One unique bit about OEV that this table shows is that reaching on an error or a catcher interference is counted as being on base, at least in part. The batter has some ownership of his advancement by putting the ball in play, so I’m giving him some credit for that.
You can also easily isolate just the extra-base hits component of the stat, similar to Isolated Power, which I call Power Expected Value, or PEV. To keep this piece lighter, I’m leaving PEV to the side for now.
If you’re following a game’s play-by-play on FanGraphs, the play results come from SIS’ software. So, for the 2019 season, I had access to SIS’ database, and with the gracious assistance of Alex Vigderman of our R&D staff, I was able to write a SQL code that produced each player’s OEV.
Below are the top 30 players in Offensive Expected Value versus the Top 30 in wOBA.
| Player | OEV | Player | wOBA | ||
| 1 | Christian Yelich | 1.128 | 1 | Christian Yelich | .442 |
| 2 | Mike Trout | 1.103 | 2 | Mike Trout | .436 |
| 3 | Nelson Cruz | 1.077 | 3 | Alex Bregman | .418 |
| 4 | Cody Bellinger | 1.077 | 4 | Nelson Cruz | .417 |
| 5 | Alex Bregman | 1.030 | 5 | Cody Bellinger | .415 |
| 6 | Anthony Rendon | 1.026 | 6 | Anthony Rendon | .413 |
| 7 | Pete Alonso | 1.014 | 7 | Ketel Marte | .405 |
| 8 | George Springer | 1.013 | 8 | George Springer | .400 |
| 9 | Ketel Marte | 1.008 | 9 | Juan Soto | .394 |
| 10 | Miguel Sano | 1.001 | 10 | Nolan Arenado | .392 |
| 11 | Nolan Arenado | .999 | 11 | Xander Bogaerts | .390 |
| 12 | Josh Bell | .990 | 12 | Anthony Rizzo | .390 |
| 13 | Charlie Blackmon | .986 | 13 | Freddie Freeman | .387 |
| 14 | Jorge Soler | .984 | 14 | Charlie Blackmon | .387 |
| 15 | Eugenio Suarez | .981 | 15 | Mark Canha | .386 |
| 16 | Xander Bogaerts | .973 | 16 | J.D. Martinez | .386 |
| 17 | Austin Meadows | .966 | 17 | Peter Alonso | .384 |
| 18 | Rafael Devers | .964 | 18 | Jeff McNeil | .384 |
| 19 | Freddie Freeman | .962 | 19 | Aaron Judge | .382 |
| 20 | Juan Soto | .962 | 20 | Eugenio Suarez | .381 |
| 21 | J.D. Martinez | .960 | 21 | Mookie Betts | .380 |
| 22 | Trevor Story | .958 | 22 | Trevor Story | .380 |
| 23 | Matt Olson | .956 | 23 | Carlos Santana | .380 |
| 24 | Joc Pederson | .945 | 24 | Austin Meadows | .380 |
| 25 | Edwin Encarnacion | .944 | 25 | Yoan Moncada | .379 |
| 26 | Aaron Judge | .944 | 26 | Kris Bryant | .379 |
| 27 | Jose Altuve | .943 | 27 | Jorge Soler | .378 |
| 28 | Jeff McNeil | .939 | 28 | Miguel Sano | .378 |
| 29 | Yuli Gurriel | .939 | 29 | Josh Bell | .378 |
| 30 | Yoan Moncada | .936 | 30 | Rafael Devers | .377 |
The top six hitters in both statistics feature the same names, in a slightly different order. While Mike Trout did reach base more than Christian Yelich in 2019, Yelich netting more extra-base hits was the biggest reason for him holding a lead over Trout in OEV.
One noticeable trend is how high home run rates really helped hitters like Pete Alonso (17th in wOBA, 7th in OEV), Miguel Sano (28th in wOBA, 10th in OEV), Matt Olson (43rd in wOBA, 23rd in OEV), Joc Pederson (t-49th in wOBA, 24th in OEV), and Edwin Encarnacion (t-49th in wOBA, 25th in OEV). A year like 2019, where the ball was leaving the ballpark at an all-time high rate, makes it more difficult to really know what the value of a home run hitter is, but we can see that extreme home run hitters can still stick out among the pack.
While strikeouts have risen with home runs, there are five hitters knocked down to the 22nd -26th range that all had strikeout rates above 30%. The stat is meant to counteract the belief that it’s okay for hitters who frequently hit the ball out of the ballpark to strike out, because not putting the ball in play wouldn’t advance a hypothetical runner on base.
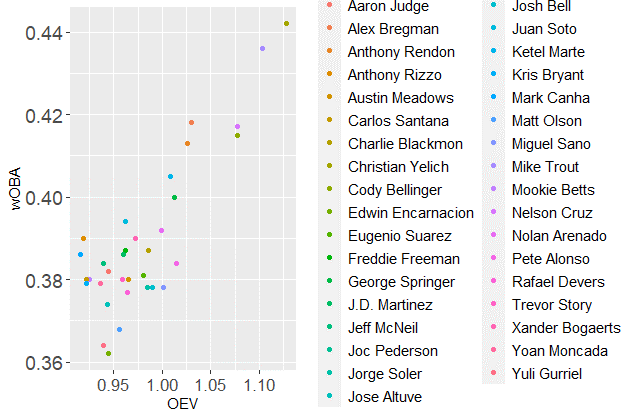
I plotted the wOBA and OEV of every player that was either in the Top 30 of wOBA or the Top 30 in OEV in 2019:
Top 30 Hitters by wOBA or OEV, 2019

Anthony Rizzo is one of the bigger outliers, ranking 46th in OEV (.919) but 12th in wOBA (.390). Pearson’s coefficient for the correlation between OEV and wOBA is .84, indicating a strong positive correlation, but there’s enough of a difference to explore the differences between the two metrics.
wOBA Versus OEV by Home Run Rate, 2019 Top Hitters
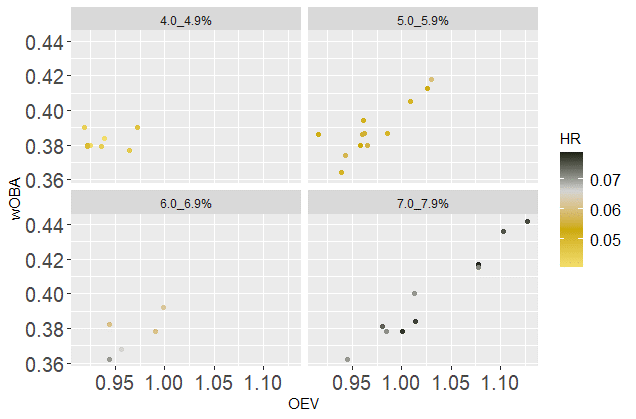
Here, you can continue to see that home run rate has a large impact on Offensive Expected Value, although maybe not in the way you’d expect. In both wOBA and OEV, there are three players with Home Run rates between 5.0% and 5.9% (Alex Bregman, Anthony Rendon, and Ketel Marte) with more value than anyone in the 6.0-6.9% range (e.g. Nolan Arenado, Josh Bell). That combined with the fact that the low-homer group tended to have lower OEV than wOBA (relative to their scales) shows that OEV doesn’t value home runs too highly.
wOBA Versus OEV by On-Base Percentage, 2019 Top Hitters
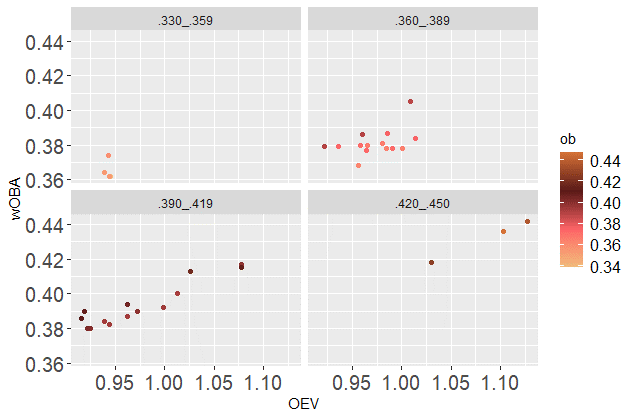
There’s a higher Pearson correlation between Home Run Rate and OEV than “on-base” percentage and OEV (.65 to .51), because of how much weight is put into home runs. However, in running a similar model for four bins of the non-traditional “on-base” percentage, there seems to be a little more of a constant where player’s OEV and wOBA go up with their OEV-based on-base average while the four groupings of home run rate are a little more clustered.
Next, I explored the relationships between a couple out types and a player’s OEV. Here I’m looking at SOuts (i.e. outs that won’t usually advance a runner, or “sole outs”) and OOuts (i.e. outs that are hit to the outfield).
OEV by SOut and OOut Rate, 2019
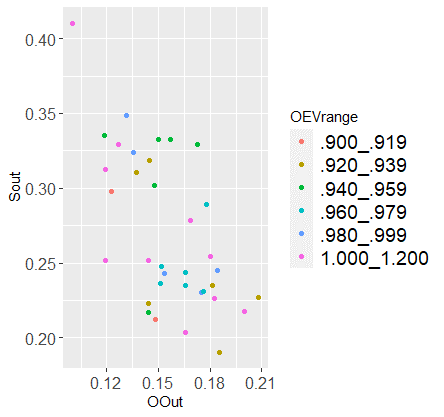
Ideally, a player would want to have a higher OOut than SOut, as a fly out could advance a potentially important baserunner, and anything that falls under SOut would not. You can see there are three players in the highest range of OEV falling nicely in the bottom right corner. That’s Anthony Rendon, Alex Bregman, and Cody Bellinger.
While not every at bat is crucial, there is value in a hitter who can hit into what’s considered a “productive out.” I also think that taking in every single plate appearance of a hitter’s season tells a better story of their season.
One limitation of the metric is that in a game situation, advancing a runner from third to home is more valuable than from first to second, but having a context-neutral element adds some fairness for fly ball hitters.
Even though baseball fans that carry an “old-school” mindset have a reputation for being averse to learning any new metric that comes out, I believe Offensive Expected Value can help bridge that gap, because it ties into the belief in productive outs, and brings value to those at bats. Thanks to SIS for allowing me to show this stat here.