By COREY EIFERMAN
Baseball Prospectus’ 2006 collection of staff essays, Baseball Between the Numbers, includes a piece by Dayn Perry titled, “When Does a Pitcher Earn an Earned Run?” In it, Perry writes that, because of the subjective scoring of errors by a stadium’s official scorer, ERA doesn’t fully do what it’s meant to do, isolate a pitchers’ performance from his defense.
Perry’s essay sparked inspiration when I read it. I wanted to create a new stat to try to more fairly assign the debit for runs given up. What follows is something I put together as my own creation, with Sports Info Solutions assisting by providing data.
Earned Run Average is simply that, an average. The actual number of ‘runs’ multiplied doesn’t *need* to be a whole number, because the result itself won’t be.
Obviously, when a player hits a (non-inside-the-park) home run, yes, the fault is 100% on the pitcher. However, within a game, many runs that are scored are both the fault of the pitcher and the defense behind him.
In addition, when runners that are inherited by one reliever score, those runs are charged to the pitcher who bequeathed them. Since those runs are the faults of two separate pitchers, both pitchers should be debited.
At Sports Info Solutions, our system of Defensive Misplays is subjective, but still stretches far beyond the binary limitations of hits and errors. When a team puts up a crooked number capitalizing on an ‘error’ by the other team, the pitcher is freed of “earned runs,” but not when there’s a borderline hit or error that was ruled a hit. That pitcher gets charged a full earned run, even though it was partially his defense’s fault.
On the flipside, if a team commits an error with two outs, and then, say, six more batters come up, the official scorer may not call any of those runs earned. Even though after that crucial error, those subsequent baserunner advances weren’t the defense’s fault.
This is where my concept, which I’m calling Split Runs, comes in.
Split Runs asks this question: What if, since a runner who scores advances four total bases, the allowance of a run was looked at in one-quarter intervals? With the assistance of the SIS R&D staff, we were able to nail down a stat that takes every base, not run, taken by every runner who eventually scored, and assign it to the pitcher who was on the mound for that runner’s at bat. Then we count the number of bases that any Defensive Misplay accounted for and subtract that from the four bases he actually traveled. Finally, we add up the number of base advancements attributable to the pitcher, except in cases where there was enough offensive action afterward that he would have scored anyway.
You can still refer to a reliever’s Inherited Runners Scored, but Split Runs applies the context of each base-state situation they entered in. Normally, if pitcher A is taken out with bases loaded, and pitcher B enters and gives up a grand slam, pitcher A would have three earned runs, and pitcher B would be charged with one. With Split Runs, now pitcher A is instead charged with 1.5 runs and pitcher B is debited 2.5 runs, as the runner who was on third advanced 1 base (0.25 runs), the runner on second advanced 2 bases (0.5 runs), and the runner on first advanced 3 bases (0.75 runs).
Below are the Top 30 Starting Pitchers in spRA, and the Top 30 in ERA from 2020, minimum 40 Innings:
| Pitcher | spRA | Pitcher | ERA | ||
| 1 | Shane Bieber | 1.69 | 1 | Shane Bieber | 1.63 |
| 2 | Yu Darvish | 1.92 | 2 | Trevor Bauer | 1.73 |
| 3 | Zach Plesac | 1.95 | 3 | Dallas Keuchel | 1.99 |
| 4 | Trevor Bauer | 1.97 | 4 | Yu Darvish | 2.01 |
| 5 | Dallas Keuchel | 1.99 | 5 | Dinelson Lamet | 2.09 |
| 6 | Dinelson Lamet | 2.09 | 6 | Corbin Burnes | 2.11 |
| 7 | Corbin Burnes | 2.11 | 7 | Clayton Kershaw | 2.16 |
| 8 | Max Fried | 2.13 | 8 | Max Fried | 2.25 |
| 9 | Brad Keller | 2.18 | 9 | Zach Plesac | 2.28 |
| 10 | Tony Gonsolin | 2.22 | 10 | Chris Bassitt | 2.29 |
| 11 | Jacob deGrom | 2.42 | 11 | Tony Gonsolin | 2.31 |
| 12 | Kenta Maeda | 2.46 | 12 | Jacob deGrom | 2.38 |
| 13 | Chris Bassitt | 2.46 | 13 | Brad Keller | 2.47 |
| 14 | Clayton Kershaw | 2.51 | 14 | Dustin May | 2.57 |
| 15 | Hyun-Jin Ryu | 2.59 | 15 | Hyun-Jin Ryu | 2.69 |
| 16 | Kyle Hendricks | 2.66 | 16 | Kenta Maeda | 2.70 |
| 17 | Carlos Carrasco | 2.68 | 17 | Taijuan Walker | 2.70 |
| 18 | Dustin May | 2.69 | 18 | Zach Davies | 2.73 |
| 19 | Zac Gallen | 2.78 | 19 | Zac Gallen | 2.75 |
| 20 | Mike Clevinger | 2.97 | 20 | Gerrit Cole | 2.84 |
| 21 | Gerrit Cole | 3.02 | 21 | Kyle Hendricks | 2.88 |
| 22 | Justus Sheffield | 3.05 | 22 | Carlos Carrasco | 2.91 |
| 23 | Blake Snell | 3.06 | 23 | Zack Wheeler | 2.92 |
| 24 | Zack Wheeler | 3.07 | 24 | Sandy Alcantara | 3.00 |
| 25 | Brandon Woodruff | 3.08 | 25 | Mike Clevinger | 3.02 |
| 26 | Zach Davies | 3.08 | 26 | Brandon Woodruff | 3.05 |
| 27 | Julio Urias | 3.15 | 27 | Marco Gonzales | 3.10 |
| 28 | Steven Brault | 3.16 | 28 | Adam Wainwright | 3.15 |
| 29 | Antonio Senzatela | 3.19 | 29 | Luis Castillo | 3.21 |
| 30 | Marco Gonzales | 3.20 | 30 | Blake Snell | 3.24 |
To better apply the defensive aspect, I’ll draw from one inning from this season that may have helped swing the NL Cy Young Award towards eventual winner Trevor Bauer.
On September 4, against the Pirates, the fourth inning began with an error by Joey Votto. Later, two runs scored on a triple by Anthony Alford. On that triple, Brian Goodwin had a Defensive Misplay (DM) for Slipping. Another run scored on a wild pitch, and the inning ended with the Pirates plating three runs, all unearned runs for Bauer.
By Split Runs, the defense was only responsible for .75 out of the three runs—0.25 for the one-base error by Votto, and 0.5 from the DM by Goodwin, whose misplay turned a double into a triple, thus allowing a runner on first to score when he might’ve held on third. That means Bauer would be charged 2.25 Split Runs.
Bauer finished with a 1.73 ERA, but his spRA was 1.97 over his 73-inning season. Yu Darvish wound up finishing with a lower spRA, 1.92, than his ERA, 2.01, over 76 innings, making this year’s Cy Young race closer than many thought.`
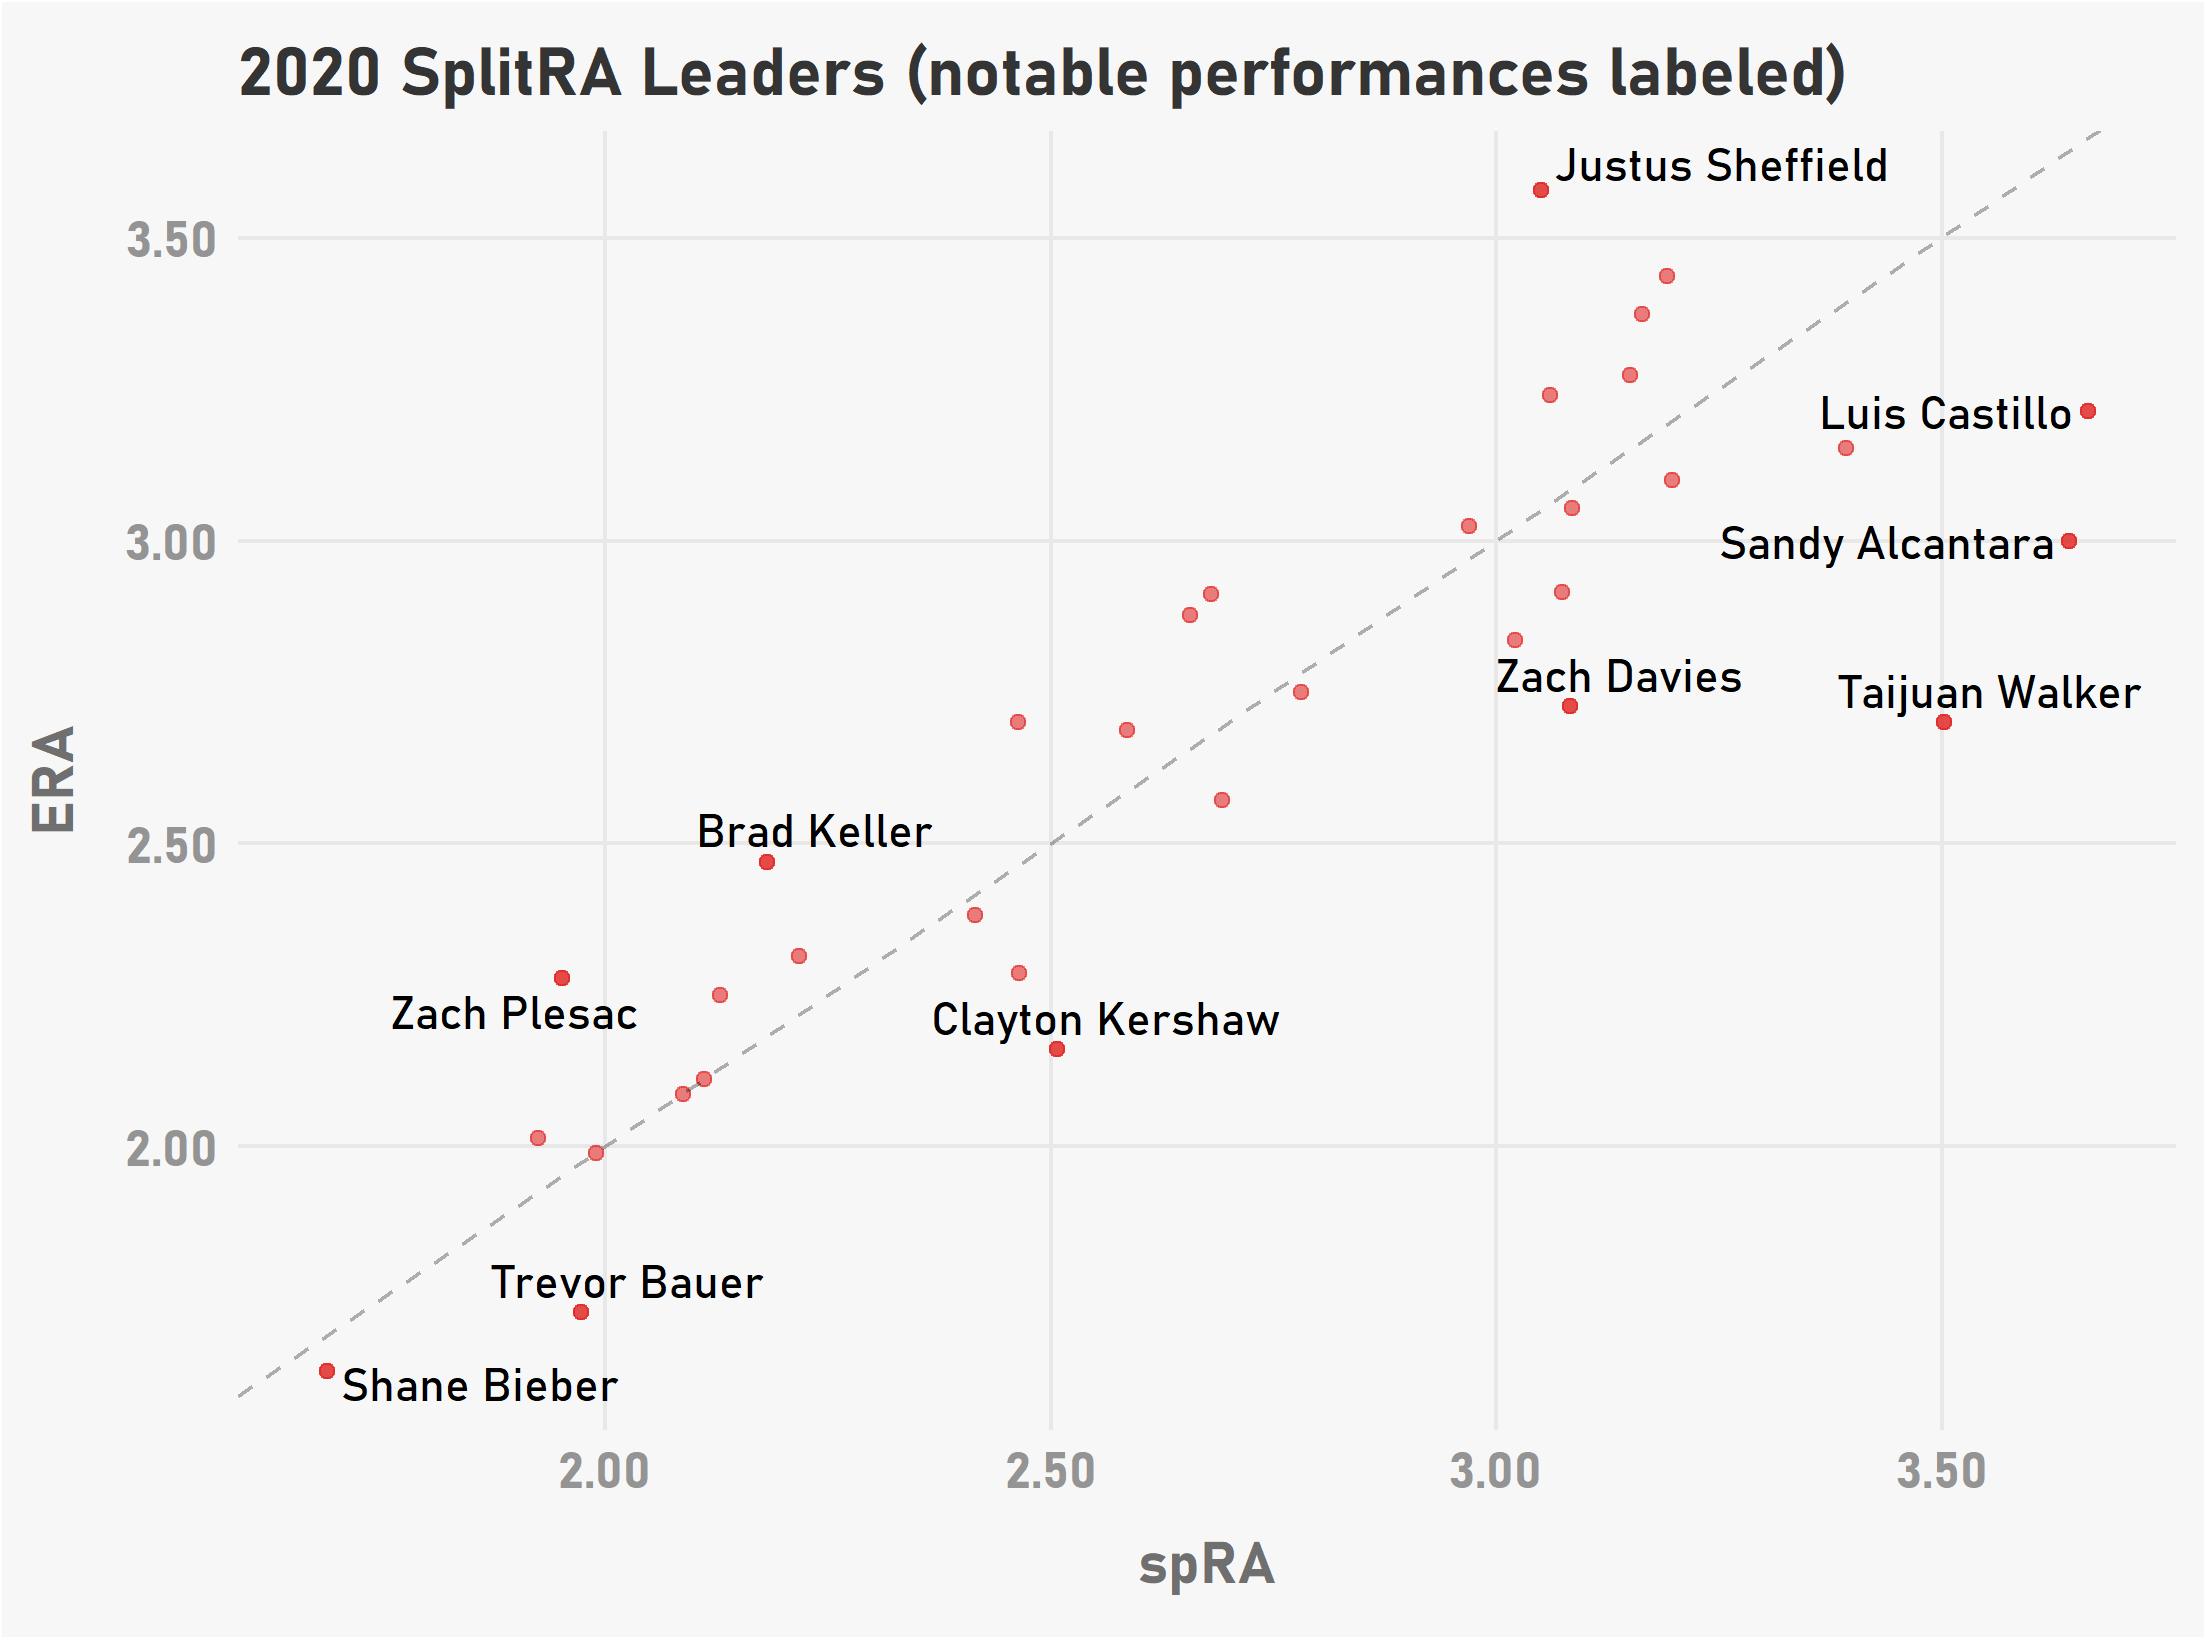
And here’s each Starter in the Top 30 of either ERA or spRA:

You can see a strong positive correlation, with Pearson’s coefficient for the correlation between spRA and ERA being .95.
However, there are plenty of pitchers with enough of a difference that make this measure of run prevention well worth tabulating and exploring.
The biggest outlier here is Justus Sheffield, who ranked 44th among qualifiers in ERA at 3.58, but 22nd in spRA at 3.05. Sheffield left seven runners on base in the 2020 season, and his relievers let six of those runners score. Those six earned runs equated to 2.75 Split Runs.
Here’s the leaderboard for Relievers in 2020:
| Pitcher | spRA | Pitcher | ERA | ||
| 1 | Erasmo Ramirez | 0.63 | 1 | Jacob Webb | 0.00 |
| 2 | Alex Colome | 0.71 | 2 | Devin Williams | 0.33 |
| 3 | Jake Diekman | 0.74 | 3 | Jake Diekman | 0.42 |
| 4 | Jesse Hahn | 0.78 | 4 | Jarlin Garcia | 0.49 |
| 5 | Devin Williams | 0.83 | 5 | Jesse Hahn | 0.52 |
| 6 | Nick Anderson | 0.96 | 6 | Nick Anderson | 0.55 |
| 7 | Yimi Garcia | 1.05 | 7 | Yimi Garcia | 0.60 |
| 8 | Kyle Zimmer | 1.08 | 8 | Erasmo Ramirez | 0.63 |
| 9 | Codi Heuer | 1.24 | 9 | Alex Colome | 0.81 |
| 10 | Matt Wisler | 1.24 | 10 | A.J. Minter | 0.83 |
| 11 | Jacob Webb | 1.35 | 11 | Adam Kolarek | 0.95 |
| 12 | A.J. Minter | 1.35 | 12 | Chris Martin | 1.00 |
| 13 | Chris Martin | 1.38 | 13 | Matt Wisler | 1.07 |
| 14 | Trevor Rosenthal | 1.52 | 14 | Darren O’Day | 1.10 |
| 15 | Jordan Romano | 1.53 | 15 | Nick Tropeano | 1.15 |
| 16 | Cesar Valdez | 1.57 | 16 | Jordan Romano | 1.23 |
| 17 | T.J. Zeuch | 1.59 | 17 | James Hoyt | 1.23 |
| 18 | Liam Hendriks | 1.60 | 18 | Cesar Valdez | 1.26 |
| 19 | Victor Gonzalez | 1.66 | 19 | Tanner Scott | 1.31 |
| 20 | Cam Bedrosian | 1.69 | 20 | Victor Gonzalez | 1.33 |
| 21 | Riley Smith | 1.72 | 21 | Drew Pomeranz | 1.45 |
| 22 | Brad Hand | 1.74 | 22 | Riley Smith | 1.47 |
| 23 | Joely Rodriguez | 1.78 | 23 | Rafael Dolis | 1.50 |
| 24 | Drew Pomeranz | 1.81 | 24 | Codi Heuer | 1.52 |
| 25 | Jeremy Jeffress | 1.83 | 25 | Jeremy Jeffress | 1.54 |
| 26 | Jarlin Garcia | 1.84 | 26 | Eric Yardley | 1.54 |
| 27 | Kyle Cody | 1.89 | 27 | Kyle Zimmer | 1.57 |
| 28 | Andre Scrubb | 1.90 | 28 | Kyle Cody | 1.59 |
| 29 | Bryan Garcia | 1.97 | 29 | T.J. Zeuch | 1.59 |
| 30 | Caleb Thielbar | 2.03 | 30 | Bryan Garcia | 1.66 |
Hansel Robles had a disastrous 10.26 ERA in 2020, but he did have a… less disastrous 7.29 spRA. Robles was hurt by how earned runs were charged. He was removed with the bases loaded twice in situations in which all three runners scored. Meanwhile, Blake Parker was the biggest beneficiary of classic Earned Runs among relievers, as his very good 2.81 ERA in 2020 doesn’t fall in line with his poor 5.06 spRA. Parker let five inherited runners score out of 14, including two from first base.
Every time there’s a Defensive Misplay leading to a run, the defense is charged a portion of a Split Run. Here are the 30 teams in terms of BIS’ flagship stat, Defensive Runs Saved, against Team Split Runs in 2020:
| Team | Split Runs | Team | DRS | ||
| 1 | Dodgers | 9.75 | 1 | Cardinals | 33 |
| 2 | Athletics | 10.75 | 2 | Dodgers | 29 |
| 3 | Twins | 12.5 | 3 | Indians | 27 |
| 4 | Brewers | 12.5 | 4 | Pirates | 26 |
| 5 | Indians | 13 | 5 | Rays | 24 |
| 6 | Reds | 14 | 6 | Cubs | 23 |
| 7 | Tigers | 14.25 | 7 | White Sox | 23 |
| 8 | Cubs | 14.5 | 8 | Twins | 22 |
| 9 | Royals | 14.5 | 9 | Mariners | 17 |
| 10 | Astros | 15.5 | 10 | Rockies | 15 |
| 11 | Nationals | 15.5 | 11 | Astros | 12 |
| 12 | Cardinals | 15.75 | 12 | Rangers | 11 |
| 13 | Rays | 16.25 | 13 | Reds | 6 |
| 14 | Rangers | 17 | 14 | Giants | 6 |
| 15 | Pirates | 17.25 | 15 | Padres | 3 |
| 16 | Diamondbacks | 18 | 16 | Marlins | 0 |
| 17 | Angels | 18 | 17 | Orioles | -1 |
| 18 | Red Sox | 18.25 | 18 | Yankees | -1 |
| 19 | White Sox | 19.25 | 19 | Diamondbacks | -2 |
| 20 | Marlins | 19.75 | 20 | Red Sox | -2 |
| 21 | Orioles | 20.25 | 21 | Braves | -8 |
| 22 | Blue Jays | 20.25 | 22 | Royals | -10 |
| 23 | Padres | 21.25 | 23 | Brewers | -14 |
| 24 | Braves | 22.75 | 24 | Tigers | -14 |
| 25 | Mets | 23.25 | 25 | Athletics | -19 |
| 26 | Yankees | 23.5 | 26 | Mets | -22 |
| 27 | Phillies | 23.5 | 27 | Angels | -26 |
| 28 | Mariners | 24.75 | 28 | Phillies | -33 |
| 29 | Rockies | 27 | 29 | Blue Jays | -39 |
| 30 | Giants | 29.25 | 30 | Nationals | -43 |
The World Series Champion Dodgers had the fewest Split Runs against them in the league, falling in line with their No. 2 overall ranking in Defensive Runs Saved. You can see that the Giants were middle of the pack in Team DRS but their misplays cost their pitchers the most total Split Runs, at 29.25.
It’s one thing to have a collective defense consistently make good plays at the right time; it’s another to prevent mistakes from happening at the most crucial times, and mistakes that could swing a game towards the other team.
If a pitcher has a higher spRA than ERA, then at least a portion of unearned runs were partially his fault. If a Pitcher has a higher ERA than spRA, then their defense made a few misplays behind him that weren’t called errors, and/or relievers came in and were unable to put out that pitcher’s fire, causing the pitcher’s ERA to go up, possibly unfairly.
I believe Split Runs works because it gets closer to a proper measurement of damage the pitcher allowed. There is some room for improvement (i.e. potentially adding in Good Fielding Plays to mirror how the system handles Defensive Misplays) but even just the splitting of responsibility between pitcher, defense, and subsequent relievers is a strong start.