By MARK SIMON
You might hear talk in some baseball circles on the value of defensive positioning. But what does that mean in practical terms?
Let’s show this visually with a look at one team (the New York Mets) and one area of the field (up the middle).
The Mets bolstered their analytics team this past offseason and changed their approach to playing defense. In particular, they’ve used many more infield shifts. They’ve had balls hit against their shifts at a per game rate 71% higher than their 2020 rate. That’s the highest increase in MLB. If the Mets keep going at their current pace, they’ll have nearly 2,400 balls hit against their shifts this season. Two seasons ago, they barely topped 1,100.
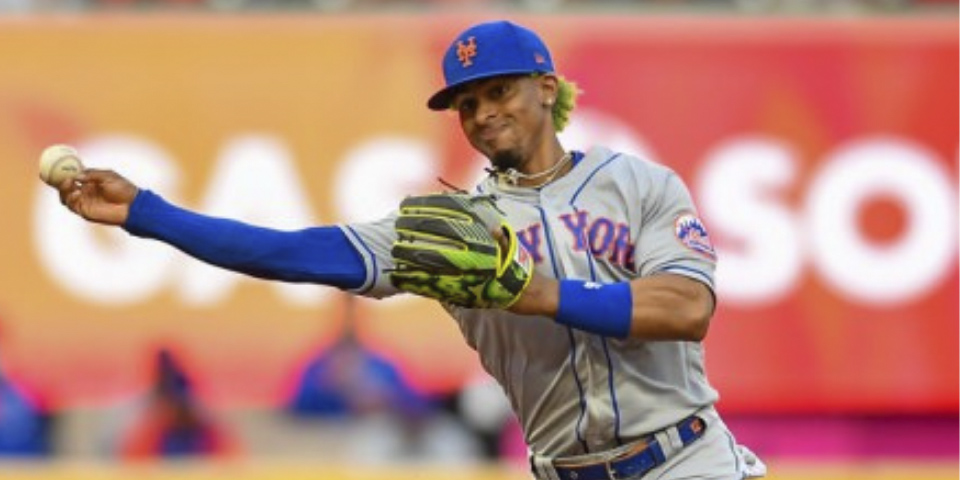
By the eye test and the numbers, the Mets have one of their better-performing defensive infields in recent memory. You can see it in how they play with Francisco Lindor helping the coaching staff direct infielder movements. Though Lindor has voiced his distaste for shifts, he abides by the plan. If you’re at a game, you’ll see him consistently directing infielders where to play. And he tends to be in the right spot too.
You can see the Mets’ overall change in approach in the image below. The dots represent the positioning of the infield defense against all batted balls in 2019, 2020, and 2021.
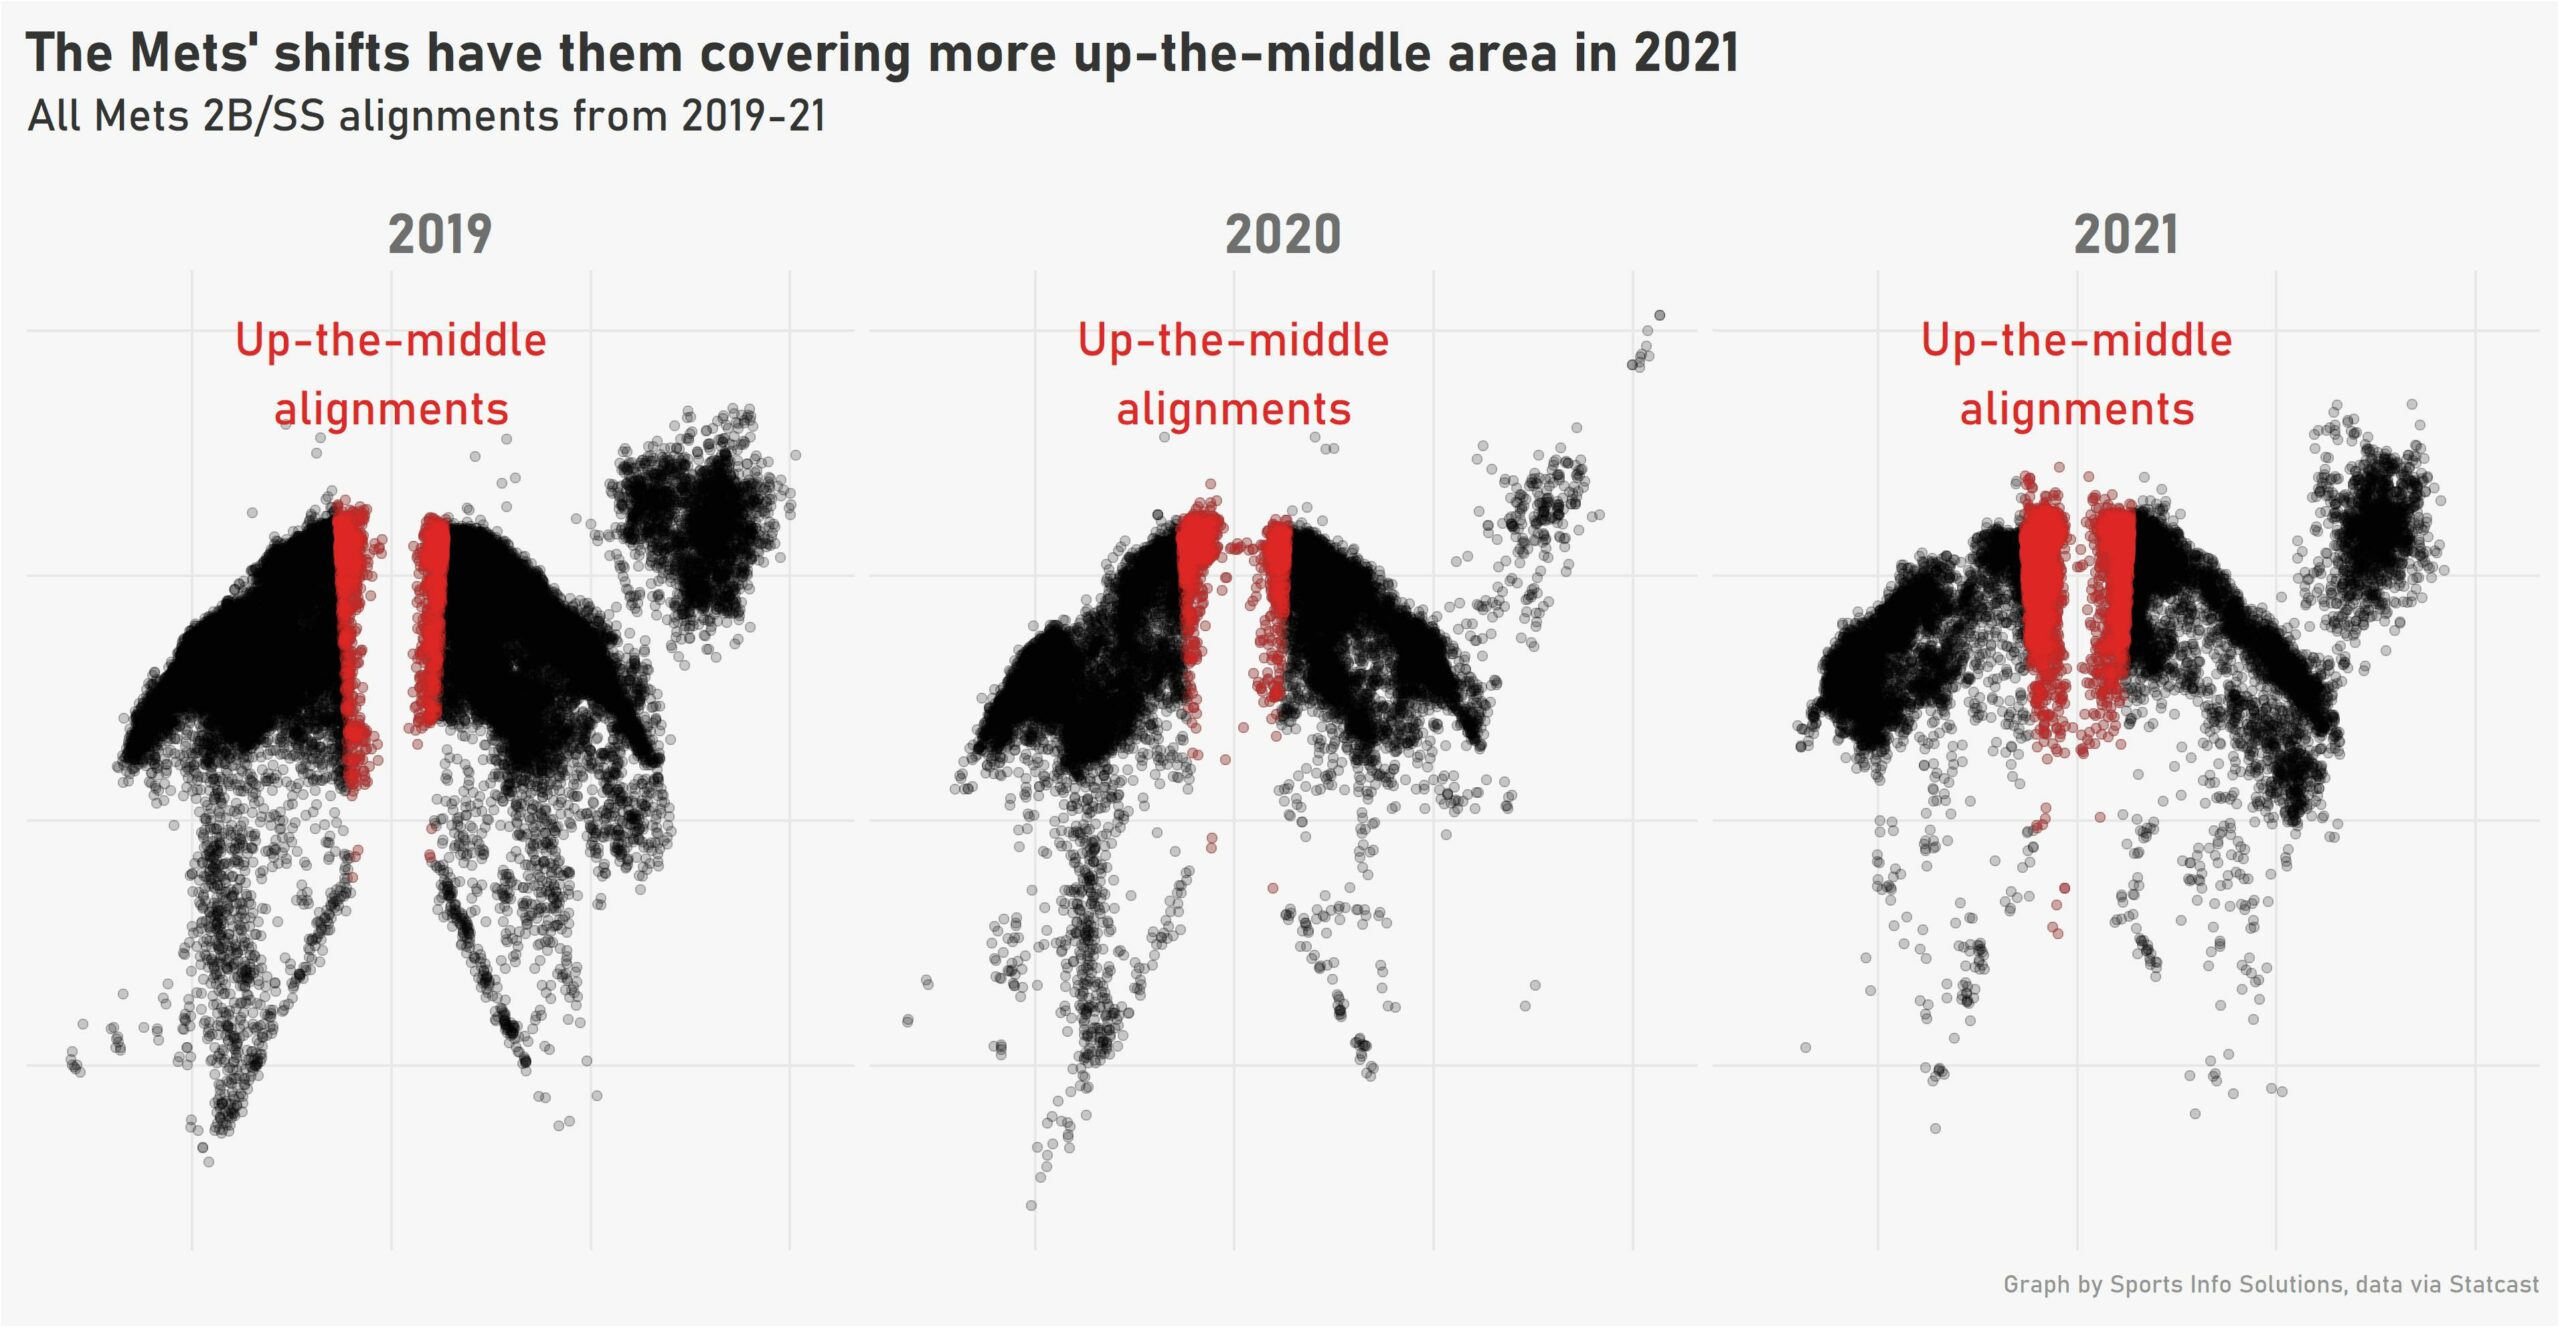
We’ve put emphasis on the area we consider up the middle by making those dots red. There’s a greater concentration up the middle as the Mets have made a concerted effort to cut off hits to that area.
Here’s how they’ve done at that – using the criteria of balls hit within about 10 feet to either side of second base and at least 65 feet (beyond the pitcher’s mound).
Ground Ball & Bunt Out Rate – Balls Up the Middle
| Season | Out Rate | Outs-Grounders | Rank |
|---|---|---|---|
| 2019 | 35% | 34-of-97 | 30th |
| 2020 | 57.5% | 23-of-40 | 18th |
| 2021 | 75% | 44-of-59 | 3rd |
Take note of two things here.
1) In 2021, two-thirds of the ground balls that have been hit up the middle against the Mets defense have come against defensive shifts (41 of 59). Two seasons ago, only 21% did (20 of 97)
2) The Mets already have converted more outs on balls hit up the middle than they did two seasons ago!
Now, the key for this to work is that it doesn’t come at the expense of any other type of ball in play. Ground balls up the middle represent only a small percentage of all ground balls hit. It’s essentially hoping that the tradeoff of giving more room for hitters to go the other way is worth it.
So here’s how the Mets have fared at turning ground balls and bunts into outs overall.
Ground Ball & Bunt Out Rate
| Season | Out Rate | Rank |
|---|---|---|
| 2019 | 73% | 20th |
| 2020 | 72% | 24th |
| 2021 | 75% | 10th |
What do the percentages mean? Had the Mets fielded grounders and bunts at a 75.3% out rate in 2020, they would have turned 20 more batted balls into outs in the shortened season. Had they done so in 2019, that would have been 41 more plays recording at least one out.
Using 2019 (a full season) as an example, a percentage point increase represents about 18 more batted balls turned into outs.
That may not sound like a lot but consider the value of not just taking away hits but also turning them into outs (some of which would have been double plays). The net result is that Mets have closed off an area of the field to hitters without a significant consequence in the aggregate.
With fielders closer to where balls are hit, plays like this are easy. And if you cut off enough hits, you might find yourself, like the Mets, in a good position in the standings.