BY CAM HARRIGAN
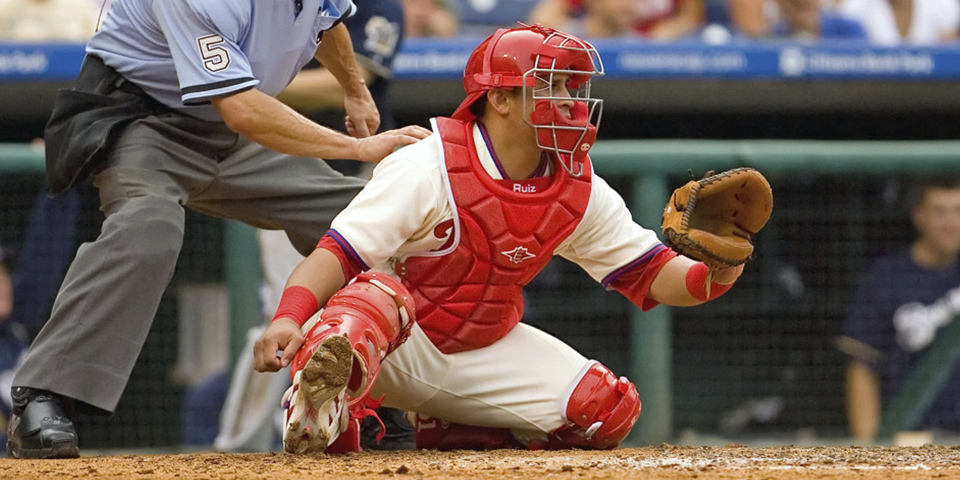
Every time a pitcher rears back and delivers an offering towards home plate they are trying to hit a spot. Whether the pitch is a wicked breaking ball that snaps off the corner of the strike zone or a blazing fastball above the letters, the pitcher has intentions for every offering.
Since we are not privy to what goes on under the pitcher’s sweat-stained brim and we are not a part of the meetings between coaches, pitchers, and catchers, we must use the next best thing: the catcher’s mitt.
The catcher’s mitt is not always reflective of the intentions for a pitch; for example, a catcher may set up on the lower outside corner of the plate for a breaking ball that’s meant to miss low and outside and draw a bad swing. However, the catcher’s mitt can provide us with the general awareness of where the pitcher wants to throw the ball. This general understanding of a pitcher’s ability to execute a pitch to their intended spot will allow us, in theory, to evaluate a pitcher’s command.
Sports Info Solutions collects the location of the catcher’s mitt for every pitch during the MLB season. For demonstration purposes, Figure 1 below shows the distribution of the location of the catcher’s mitt during the 2020 MLB season. Note: Colors are for stylistic purposes only.
Figure 1: Catcher Mitt Location on all Pitches (2020)
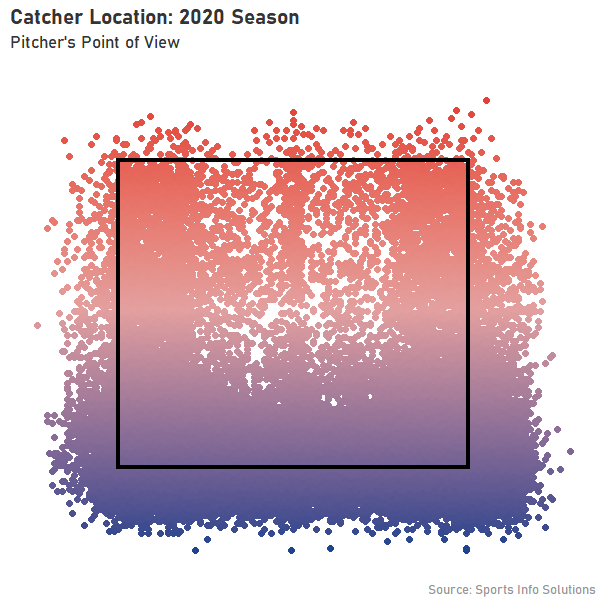
For the vast majority of pitches the catcher sets up in or below the bottom third of the strike zone (84.9%). This does not necessarily mean that the pitcher intends to throw in or below the bottom third of the zone, it is more likely a reminder from the catcher for the pitcher to favor down in the zone with their offering.
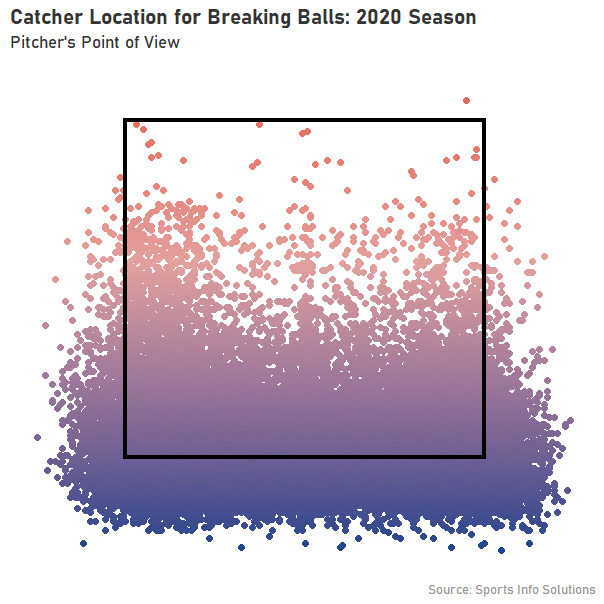
Figure 2 below shows catcher mitt location for breaking balls in 2020 (sliders and curveballs). The distribution of mitt location is much more biased toward the lower third of the zone. This makes sense because of the negative consequences of leaving a breaking ball up in the zone. Since 2019, the catcher’s mitt has been in the upper third of the zone for a breaking ball 0.3% of the time, in the middle of the zone 3% of the time and in the lower third of the zone a whopping 97% of the time.
Figure 2: Catcher Mitt Location on Breaking Balls (2020)
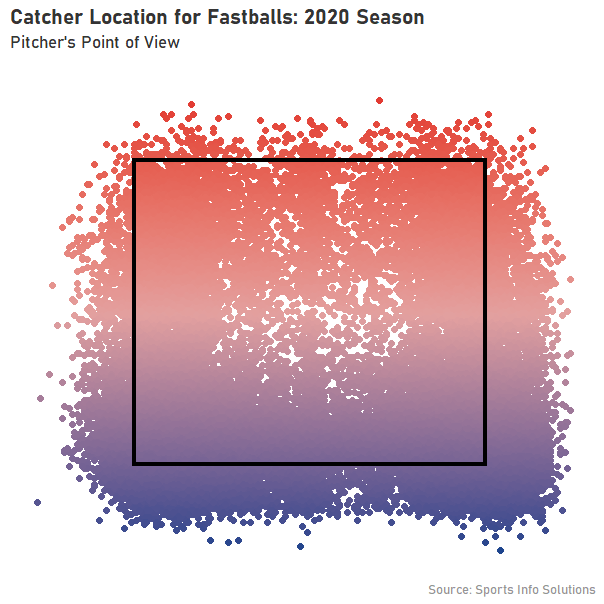
On the other hand, fastballs have a representative sample in the upper two thirds of the strike zone. Since 2019, catchers have set up in the upper third 11% of the time, the middle third 13% of the time and in the lower third 75% of the time. A graphical representation of catcher mitt locations for fastballs during the 2020 season is shown below in Figure 3. The more even distribution of catcher targets around the strike zone and the greater accuracy of fastballs in general make them the best target for an analysis of command using this data.
Figure 3: Catcher Mitt Location on Fastballs (2020)
So, what are the consequences if a pitcher misses their target?
We’ll look at four metrics when analyzing the effectiveness of a pitch:
- Swinging Strike Rate- The percentage of times a pitch produces a swinging strike
- Take Rate- The percentage of times a pitch is taken by the batter
- Contact Rate- The percentage of times the hitter makes contact with a pitch**.
- Expected Slugging Percentage on Balls in Play (xSLGBIP)- The expected slugging percentage using Defense Independent Batting Stats for balls put in play by the hitter, including home runs. A measure of the hitter’s contact quality.
** Note: This version of contact rate should not be confused with Fangraphs’s definition of contact percentage, which is per-swing instead of per-pitch.
A few other notes before we dig in:
- To focus the analysis, this research examines only the effects of a pitcher missing their target vertically.
- This research only examines pitches that are ‘over the plate’. ‘Over the plate’ is defined as pitches within 1 inch outside the edges of the plate.
- The pitcher’s target is defined as plus or minus 3 inches from the center of the mitt as the vertical target since it is roughly representative of the size of a catcher’s mitt and a ninth of the strike zone.
- Because the catcher’s target is most often low in the zone, but pitches aren’t distributed that way, it stands to reason that low catcher targets don’t tell us as much as middle or high targets. So, this research focuses on the latter two categories.
Table 1 displays the metrics for all fastballs thrown since 2019 that we have catcher mitt data on. It should be noted that the average vertical pitch location for fastballs is slightly above the middle of the strike zone and the average vertical catcher location for fastballs is in the lower third of the strike zone. This does not mean pitchers are wildly inaccurate; it further reiterates that the catcher setting up low does not mean the pitcher intends to throw low.
Table 1: Fastball Performance (2019-2021)
| Total Pitches | Swinging Strike Rate | Take Rate | Contact Rate | xSLGBIP |
| 522,230 | 10% | 45% | 45% | .594 |
Since the catcher setting up low is not indicative of the pitcher’s intention to throw low, we’ll examine the data when the catcher sets up in the middle and upper third of the strike zone. There are enough high catcher targets and high fastballs that we can analyze the consequences of a miss in these zones.
Table 2 below shows fastball performance when the catcher’s mitt is presented in the middle third of the strike zone.
Table 2: Fastball Performance with Catcher Mitt in Middle Third of Strike Zone (2019-2021)
| Miss Direction | Total Pitches | Swinging Strike Rate | Take Rate | Contact Rate | xSLGBIP |
| High | 37,186 | 15% | 44% | 41% | .580 |
| None | 18,865 | 10% | 27% | 63% | .619 |
| Low | 15,433 | 5% | 54% | 41% | .587 |
Unsurprisingly, Swinging Strike Rate increases as the ball is located higher in the zone. Take Rate also expectedly increases as the pitch is located away from the center of the strike zone.
This increase in Take Rate results in a lower Contact Rate since the batters are swinging less. Expected Slugging Percentage on Balls in Play, the measure of contact quality, is highest when the ball is in the middle of the strike zone.
Therefore, we can conclude that when the catcher’s mitt starts in the middle third of the strike zone missing the target high benefits the pitcher, hitting the target is a good way to induce contact, and missing low weakens the quality of contact, but will result in more pitches being taken.
A high fastball is a way for a pitcher to produce a swinging strike.
Table 3 below, a summary of fastballs with a high catcher target since 2019, clearly displays the benefits of the high fastball and the consequences of the pitcher missing a high target.
Table 3: Fastball Performance with Catcher Mitt in Upper Third of Strike Zone (2019-2021)
| Miss Direction | Total Pitches | Swinging Strike Rate | Take Rate | Contact Rate | xSLGBIP |
| High | 25,446 | 15% | 62% | 23% | .512 |
| None | 18,867 | 19% | 21% | 60% | .567 |
| Low | 16,796 | 9% | 31% | 60% | .660 |
Executing a pitch or missing high up in the zone increases the Swinging Strike Rate for a fastball, supporting the statement that a high pitch is the best way to induce a swinging strike with a fastball.
In this case, missing high results in a drastic increase in Take Rate, which makes sense since the offered pitch is more than likely out of the zone.
Expected Slugging Percentage on Balls in Play is also lower than the average fastball for pitches high in the zone. This is indicative of a hitter not being able to drive a ball at their letters and instead popping it up.
A pitcher pays for a pitch missed low when the catcher is set up high. Both the Swinging Strike Rate and Expected Slugging Percentage on Balls in Play are worse for the pitcher than if the catcher sets up middle and they throw middle.
It is interesting how the Take Rate for low misses in this zone increases by close to 50% when compared to pitches on target. While some of these pitches are going to be out of the zone low, these are pitches with high targets.
Table 4 shows that plenty of those low misses are still in the zone.
Table 4: Fastball Takes with Catcher Mitt in Upper Third of Strike Zone (2019-2021)
| Miss Direction | Total Pitches | Take Rate | Taken Strike Rate | Taken Ball Rate |
| High | 25,446 | 62% | 2% | 60% |
| None | 18,867 | 21% | 9% | 12% |
| Low | 16,796 | 31% | 18% | 13% |
The increase in Take Rate observed when missing low on a high target is almost completely attributed to taken strikes. This could be a possible inefficiency for hitters and coaches to investigate. There is a drastic increase in Expected Slugging Percentage on Balls in Play that is not being taken advantage of when the hitter takes this pitch.
Another possible explanation for the increase in Take Rate for pitches thrown more towards the center of the strike zone could be the count. One could argue that a hitter is more inclined to take a fastball in the middle of the strike zone with a hitters’ count.
Surprisingly, when hitters’ counts are removed (3-0, 3-1, 2-0, 2-1, and 1-0) the Take Rate still increases for low misses with the catcher set up in the upper third of the strike zone.
Next Steps
We may not be able to uncover an explanation for why hitters take fastballs thrown towards the middle of the strike zone when the catcher is set up high in the strike zone. Looking at which hitters take a higher or lower percentage of these pitches may shed some insight on if this is a skill that is correlated to prolific hitting.
Attributing vertical command to a pitcher is a step in the right direction towards evaluating a pitcher’s ability to produce effective results.
For example, pitchers that miss low on fastballs intended to be up in the strike zone give up a higher quality of contact on average.
However, there are outliers because some pitchers manage a high swinging strike rate and low quality of contact while missing their target low.
Possible explanations for this include higher spin rates that make the pitch perform better than its location would suggest, supreme command on the horizontal axis, or the type of fastball: 2-seamer or 4-seamer.
Moving forward, research can determine if elite vertical command truly results in success at a pitcher-pitch level.