At SIS, we use a role-based grading scale for draft prospects. That means that we’re not as concerned about what round you should select a player; instead, we focus on the mix between the overall quality of the player and the kind of role he could take for an NFL franchise.
Our grades are meant to be taken as a projection for the player by their second NFL season. There is a bit more detail than this, but as a rough guide, you can think of our grading scale this way:
| Grade Range | Rough Description | % of grades from 2019-21 |
| 7.0-9.0 | Blue Chip / All Pro | 2% |
| 6.7-6.9 | Strong Starter | 17% |
| 6.5-6.6 | Situational Starter | 17% |
| 6.2-6.4 | Role Player | 36% |
| 6.1 or below | Backup | 28% |
These grade ranges, if calibrated appropriately, should bear themselves out in terms of both playing time and performance on the field. This might seem like an obvious thing to say, but it’s important when you’re in the business of analysis to check your assumptions and make sure they’re valid!
The intent is, naturally, to project players accurately. But there are always players who find themselves in particularly good or bad situations in terms of playing time, so sticking too close to the starter/backup distinction is a bit rigid.
Let’s take a few different angles and see how these grading ranges relate to NFL outcomes.
For all of the below, I’ll be using results from the last three draft classes. I’ll also be lumping in the players with grades of 7.0 or higher with the group below, because that group is too small to analyze on its own (and small enough that it won’t bias the result).
In the case of the 2021 class, they haven’t had a chance to play their second season, which means they haven’t had as much opportunity to make an impact. As a result, it’s fair to assume that we’re slightly underestimating the value of our grades by including these players. The 2021 quarterback class is a particularly apt example, given the mix of subpar opportunity and performance from all but Mac Jones.
Relating Pre-Draft Grade to NFL Playing Time
Here we’re taking the grade ranges from above and looking at how often players in each group get on the field. This is on a per-season basis to put the 2021 draftees on an even playing field, and uses position-specific quartiles that account for differences in typical snap counts by position.
Per-Season Snap Count Percentiles, 2019-21 Draftees’ First Two Seasons
| Grade Range | > 25% | > 50% | > 75% |
| Strong Starter (6.7+) | 82% | 73% | 50% |
| Situational Starter (6.5-6.6) | 68% | 41% | 22% |
| Role Player (6.2-6.4) | 47% | 28% | 9% |
| Backup (6.1 or lower) | 37% | 19% | 6% |
You can see that there are nice monotonic relationships. The top graded players are multiple times more likely to achieve snap counts in the 75th percentile than anyone with less rosy grades. Those graded as situational starters are more likely to be below the median than above it. And players with role player or backup grades are more likely to be in the bottom quartile than the upper three quartiles.
It’s very likely that part of the reason that the players with “strong starter” grades are so much more likely to get substantial playing time is that teams are more likely to give top draft picks more opportunities. After all, two-thirds of those players have been drafted in the first two rounds—and nearly all of the players with a 6.9 grade or higher.
Relating Pre-Draft Grade to NFL Performance
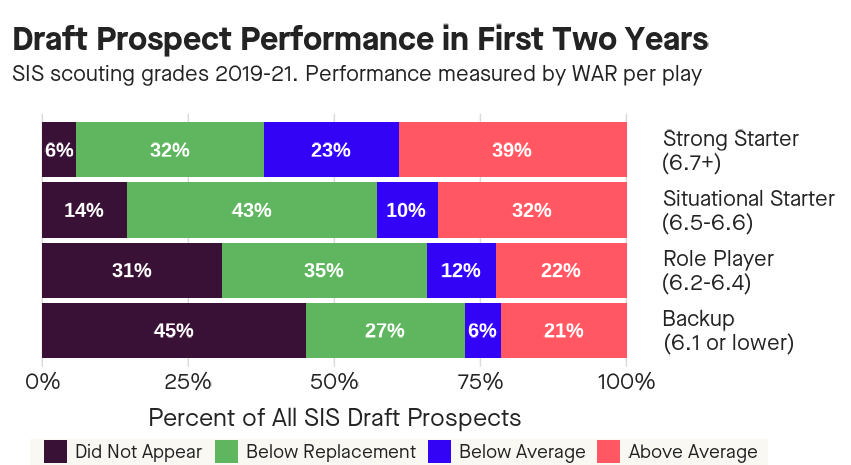
To the previous point, it’s insufficient to judge a pick on playing time. So let’s take a similar angle, but instead use the player’s Wins Above Replacement (WAR) per play.
Analogous to the above, we’ll look at the odds of a player not making it onto the field, playing but being a sub-replacement contributor (i.e. recording a below-zero WAR), and being a solid contributor (i.e. recording an above-average WAR).

Once again, we come to the encouraging conclusion that higher grades yield better NFL outcomes. But the picture is muddier this time around.
In contrast to the rather dramatic and consistent trend for playing time, the relationship between pre-draft grade and performance is less stark. In particular, we find that there is a larger gap in per-play performance between the starter and backup grades than between the different backup-level grades. Higher grades correspond most strongly with getting onto the field and with being above average, but there are plenty of examples of sub-par performance regardless of the scouting grade.
Takeaways and Next Steps
We’re still in the early days of our scouting operation, but so far we are doing a good job in projecting a player’s likelihood of making an NFL impact. Keep an eye on a player’s grade within that range of 6.2 to 6.9, because the outcomes for that middle-to-upper-middle class of players can vary quite a bit. We can see an effect not only in playing time but also in performance.
As discussed on the Off the Charts Podcast, we are really excited to look at this with more seasons of data and more targeted analysis of the value of specific positional factors. Players often land in spots that don’t allow them to achieve their projection (think Jordan Love in Green Bay as an extreme example), so we want to be able to make additional adjustments beyond taking the sample of draftees as a whole.