Throughout the draft process, the words continue to echo: production profile, athletic freak, stats dominator, elite testing numbers. But what actually matters to NFL teams? Looking at athleticism through the lens of NFL Combine testing, as well as the production found through our proprietary stat, Total Points, can we identify what NFL teams value?
The Data
Using the data available, college stats and combine metrics all are between 2016-2020 (as the 2021 class did not have a combine). For these 4 classes, production was measured as their stats from the preceding year (for many, their senior year).
Every position has different stats, but at SIS we invented Total Points, a measure to explain a player’s value in the scale of points on the scoreboard. This has been tracked from 2018 onwards for college. Knowing our draft sample is of multiple years before Total Points was tracked, I had to come up with a solution to retroactively fit production metrics to a Total Points stat.
I built a regression model for each position using the 2019 and 2020 classes as my training set. 2021 was ignored due to the differences in schedule lengths, and the many obstacles players experienced that season. Attempting to predict the percentile rank of a player’s Total Points, I used the player’s percentile rank in each of many selected statistics relevant to the position. Rather than averaging these percentiles, this regression model gives weights to the stats more related to Total Points. This allows us to approximate their Total Points as a measure of production from any season.
This predicted Total Points gives a “Production Score”, between 0 (bad) and 100 (good). To illustrate what it looks like, these are the top 5 WRs:
| Rank | Player | Production Score |
| 1 | Andy Isabella | 95 |
| 2 | Justin Jefferson | 94 |
| 3 | Taywan Taylor | 94 |
| 4 | Zay Jones | 94 |
| 5 | Keke Coutee | 93 |
With a lack of sufficient stats for seasons prior to 2018, offensive linemen were excluded from the analysis.
The athletic scores get a little bit trickier, as not every player accrues scores. It’s not uncommon for players to skip the combine for a multitude of potential reasons. Among those that do compete, some choose selective tests they have trained and know they will perform well in, while others participate in everything they are eligible for.
Using a similar percentile ranking format as for production, players are compared on their tests among others at their position. Players are first checked to make sure they completed 3 different tests, then their lowest percentile score is dropped to eliminate the ambiguity of selective testing, missing for injuries, or common issues like a slip. The remaining scores are averaged to get an “Athletic Score”, also between 0 and 100. To illustrate what that looks like, here are what the top RBs look like:
| Rank | Player | Athletic Score |
| 1 | Justice Hill | 75 |
| 2 | Saquon Barkley | 71 |
| 3 | Darrynton Evans | 68 |
| 4 | A.J. Dillon | 66 |
| 5 | Justin Jackson | 65 |
This isn’t a gauge of what translates into the NFL, it’s a study into what we can learn from teams’ draft trends. We are observing how they compare to each other through the lens of athleticism and their production profiles, and seeing how they translate to draft pick overall.
What Helps a Player Get Drafted Higher?
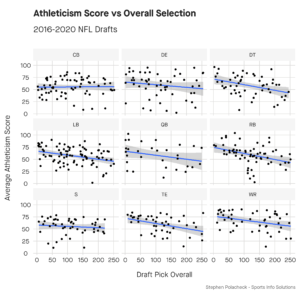
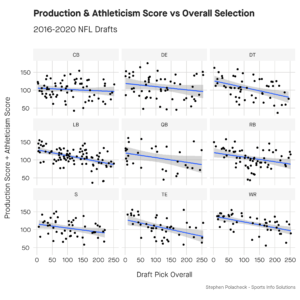
The simple answer is obvious: both. But we can do better than that. In the following charts, we can see the correlation of each of the production and athletic profiles with the draft position, as well as the two together.
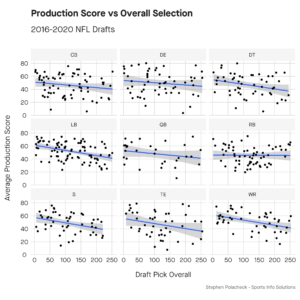
So what do these tell us?
There are a few positions that see little correlation between either score and where they end up getting drafted (Cornerback, Defensive End, Quarterback, Safety). These are positions you could consider as “film positions,” as teams may look more for traits and on-field abilities rather than their overall performances in various metrics. The non-correlation between draft pick overall and production score for these positions tell me these metrics are not an ultimate decider of whether they are picked or not.
Five positions really jump out, and are worthy of their own breakdowns.
There is a gigantic difference between production and testing for running backs. While looking at production (which offers both rushing and receiving stats), there is almost no correlation. But when it comes to testing, that is the higher driver of draft capital. Only one player was drafted in the top 100 that didn’t have an above average athleticism score (Devin Singletary). Regardless of college production, the NFL is looking for good combine testing in running backs.
Tight ends weigh in similarly to running backs. Production profiles are a bit scattered and all over the place, but when it comes to athletic testing, it stabilizes. However, the combined two metrics paint a good picture as to how high a tight end may get drafted, as seen in the combined (third) chart.
Defensive tackles come with little predictability of production and athleticism, but when paired together, there’s a better vision. Neither work as individual metrics to predict draft position, but together, they help identify the higher-valued players.
Linebackers have the highest correlation of any position to a production score. A productive LB is more likely to be selected before a less productive player, compared to the other positions. Being athletic is also highly desirable, so the two scores together fill out a very solid predictive line.
Wide receivers follow a similar style, while the metrics are strong individually, they work very well when combined together. When a WR performs on the field, and backs that up with a solid combine, they get selected high.
Generally, it seems like the combine matters more than production. Which it does, as a random player’s athleticism score compared to their overall selection number has a correlation score of 0.25, where the same metric for production is at 0.24. The two r correlation scores are so similar, a conclusion of either mattering more than the other cannot be made, and these r values are relatively low and suggest more of a non-correlation.
The bottom line is, no, we cannot confidently guess a player’s overall draft pick number using these scores, but together, their r correlation score comes to a respectable 0.33.
What do Teams Value?
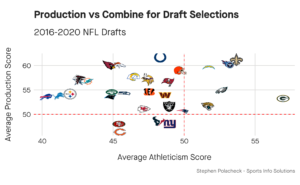
One especially interesting way to use these numbers is to evaluate how teams draft. We can look to see what teams are looking for in prospects. Can you guess what a team is going to look for in a prospect? If so, does it hold value to you as a competitor?
In all of these charts, trending to the top right is a team who likes their selections to be proven on paper, both by production and combine testing. In the bottom left, those are teams that are more likely to look for traits on film, rather than what can be seen by metrics.
Where a team falls on these charts is not to be taken as a positive or a negative, as there are varying degrees of success all over. It is highly likely that there are teams somewhere in the middle that don’t especially value production or the combine, but have drafted toward the league average while not paying extra attention to these inputs.
The value in the following charts is from looking at the extremes, not the centers.
When looking at how teams draft, there are a few teams who really like high combine testers in the Packers, Saints, Titans, Eagles, Chargers, and Jaguars. There are teams that really value college production in the Colts, Saints, Titans, Broncos, Cardinals, Chargers, and Browns.
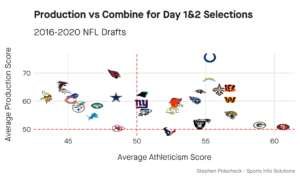
But that’s the whole draft—what if I only care about the early picks? Those come with some wildly different results (albeit small samples of only 4 drafts), where the 49ers and Packers seem to really stress the combine performances along with many of the teams mentioned above, except for the Eagles, who fall to the middle. The Colts, Broncos, Saints, Titans, and Cardinals are very high in looking for college production in early picks of drafts (Jonathan Taylor an example).
When looking only at days 1 and 2, the most surprising metrics to me are the amount of teams drafting players with below-average athletic scores. 12 teams have averaged drafting sub-par athletes based on combine metrics. To be fair, the Kansas City Chiefs won a Super Bowl as one of those teams, but many of the other teams below the threshold are recent bottom-dwellers (Jets, Lions, Dolphins, Bears).
While the entire league drafts above average producing players in these early rounds, the Chiefs, 49ers, Packers, and Texans have each taken average-producing players.
When the draft hits the later rounds, the emphasis turns from finding starters to more dart throws. Looking for upside, teams are trying to find low-cost players who could return in-game value, and we see teams shift their emphasis as they get to this later stage.
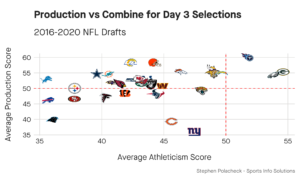
The Packers, Eagles, and Titans are the only teams to draft above-average athletes at this stage. These are teams that historically bank on players’ athletic traits. The Titans, Browns, and Rams are teams that look for production in college for their picks. The Panthers, Bills, Lions, 49ers, and Steelers evidently have little emphasis on combine results. The Giants, Bears, and Panthers evidently do not care for college production.
The red dotted lines indicate the average/average prospect, which matches across all plots. Comparing teams over each of these charts holds some interesting results, as the Chiefs and Rams tend to draft more productive players later in the draft, and the 49ers go from a combine-heavy team to a team that doesn’t care for it as the draft progresses.
Another big takeaway is how athleticism tails off as we approach the later stages of the draft, where production remains a bit steadier. This implies teams emphasizing the combine early, and keeping the same emphasis on production throughout.
Overall, the teams drift from the highly productive and highly athletic players, to the ones who don’t measure up as well. The overall takeaway and the study’s bottom line is that college production and combine results BOTH matter to NFL teams.