If you were watching the third inning of this game between the Marlins and Pirates last Saturday, you would probably have glossed over this play by Joey Wendle and not thought much of it.
Understandably so. Based on where Wendle is positioned, that ball – hit 86 miles-per-hour by Nick Gonzales – has a 78% out probability.
But what you didn’t necessarily see was that the Marlins positioned Wendle ideally for that ball. Wendle wasn’t overly pull oriented for Gonzales, a right-handed batter and recent call-up. He was situated such that that ball was well within his reach.
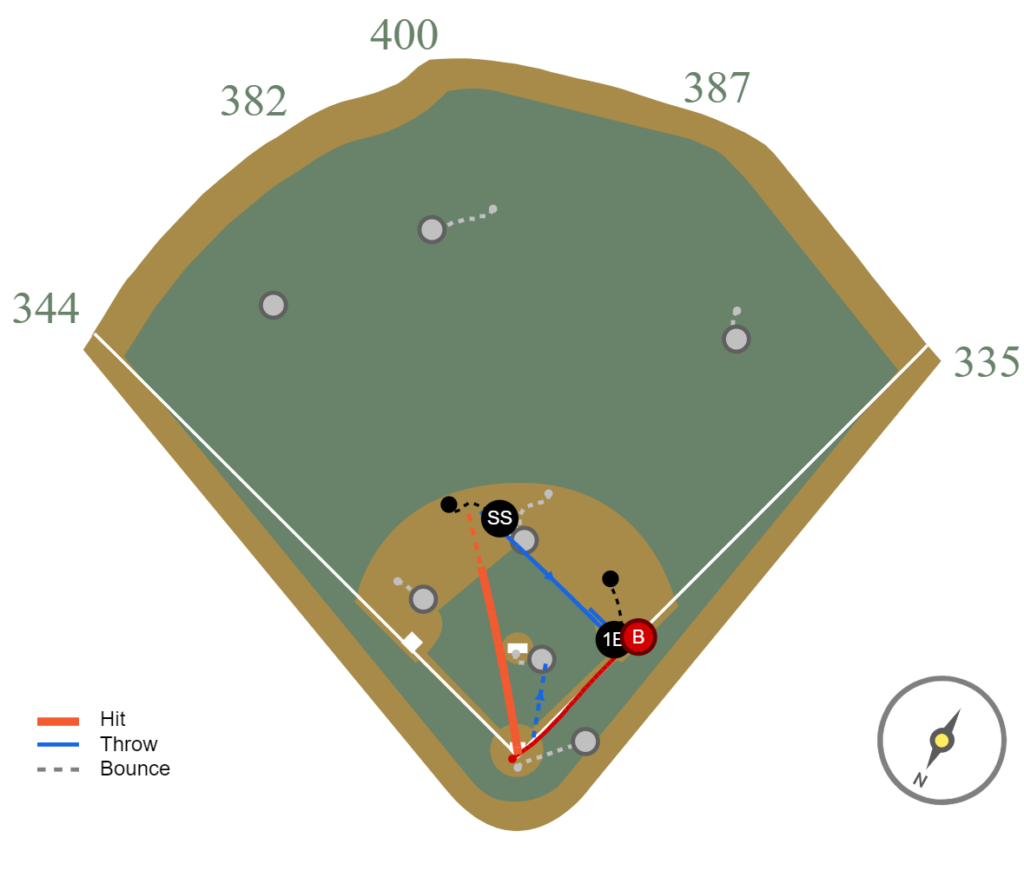
A fair number of balls hit to that spot and at that speed by right-handed hitters get through the infield.
In fact, if we didn’t know where Wendle was standing, the out probability on that ball would have been just 21%.
So to summarize, this ball has a 21% out probability when we don’t know where Wendle is positioned and a 78% out probability when we do.
This play serves as a good example of how we credit for positioning within a team’s Runs Saved calculation.
The Marlins team gets a credit of about 0.4 Runs Saved for increasing the out probability on this play from 21% to 78%
To calculate how teams fare related to infield positioning, we look at every batted ball in this same fashion. Sometimes the team increases its out probability with its infield positioning. Sometimes it decreases it by putting a fielder in a spot in which he can’t make a play or has a more challenging play to make.
In a season in which every run has truly counted for the Marlins (look at their 19-5 record in one-run games), good defensive positioning is one of those things that has fallen in their favor and could be a difference maker if maintained through 162 games.
The Marlins currently lead the majors in their Runs Saved from infield positioning.
Most Runs Saved From Infield Positioning
| Team | Runs Saved |
| Marlins | 18 |
| Cardinals | 13 |
| Brewers | 10 |
| Yankees | 9 |
| Braves | 9 |
As such, the Marlins rank tied for 2nd in the combined total of Runs Saved they’ve gotten from their four infield positions combined with their infield positioning. With 21 Runs Saved, they’re tied with the Rangers and 1 run behind the Rays.
“They’re all extremely engaged,” said Marlins third base and infield coach Jody Reed. “Coming into this season there was talk that this was going to be a problem area for us and they took it personally. They set out to make it go the other way.”
How we make the calculation
To walk you through this again, the way we calculate positioning value is
A) We calculate the out probability of a play using the variables available from our ball in-play tracking. Those inputs for balls hit on the ground include where the ball was hit, how hard it was hit, whether the defense was shifted, and how fast the batter is.
And then
B) We recalculate that out probability, adding the input of where the player was positioned.
The positioning value, calculated in both plays saved and runs saved both in totality and on a per-play basis, comes from simple subtraction: B minus A.
So for example:
A ground ball up the middle may have a 50% out probability for the second baseman if we don’t know where he is positioned and presume “average” positioning.
But if we know where he is positioned, which for the purposes of this example can be “almost behind second base” we can recompute the out probability to 90%. Thus, then we know the positioning value of the play to be .4 (90% minus 50% to reflect how much the out probability improved). The run value is then computed accordingly based on where and how hard the ball was hit to account for whether the ball might have been an extra-base hit.
If on that same ball, the out probability went from 50% to 20% once we knew the second baseman’s positioning that would be an example of bad positioning. The team would be dinged .3 positioning plays saved (50%-20%).
A team can be rewarded for its positioning on a play in which it didn’t record an out. A team can also be penalized for positioning on a play in which it did get an out.
More on the Marlins
The Marlins infield positioning success this year is a credit to the work done by both Reed and the team’s analytics department, which creates a series of positioning templates for each game for each pitcher (as most teams do in 2023).
Their system is such that the players can look at a positioning card or look to the dugout where Reed will quickly guide them in time such that they’re ready before the first pitch to the next batter. A player has the freedom to move a step or two in a particular direction based on what they see.
There are plenty of examples of the Marlins benefiting from their defensive positioning all around the diamond. Just from June, there’s the 106-MPH rocket hit by Julio Rodriguez right to first baseman Yuli Gurriel. The play was a routine one, a 79% out probability because Gurriel’s positioning increased the out probability by 43%.
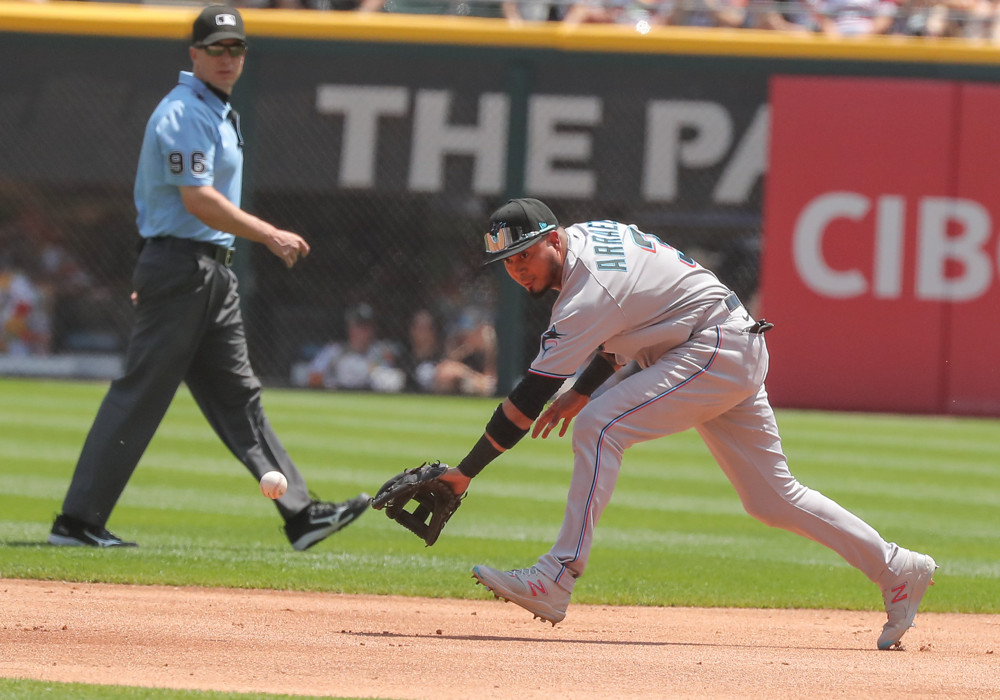
At second base, there were some who wondered if Luis Arraez could handle the position well. He’s at 1 Run Saved but the Marlins have maximized his value through defensive positioning. They’ve recorded 7 Positioning Runs Saved relative to where they’ve played Arraez. That’s the most Positioning Runs Saved for any team of any player at a particular position this season (in other words, they’ve supplemented his skill by putting him in the best position to make outs.
“He’s been overwhelmingly better than anyone expected,” Reed said.
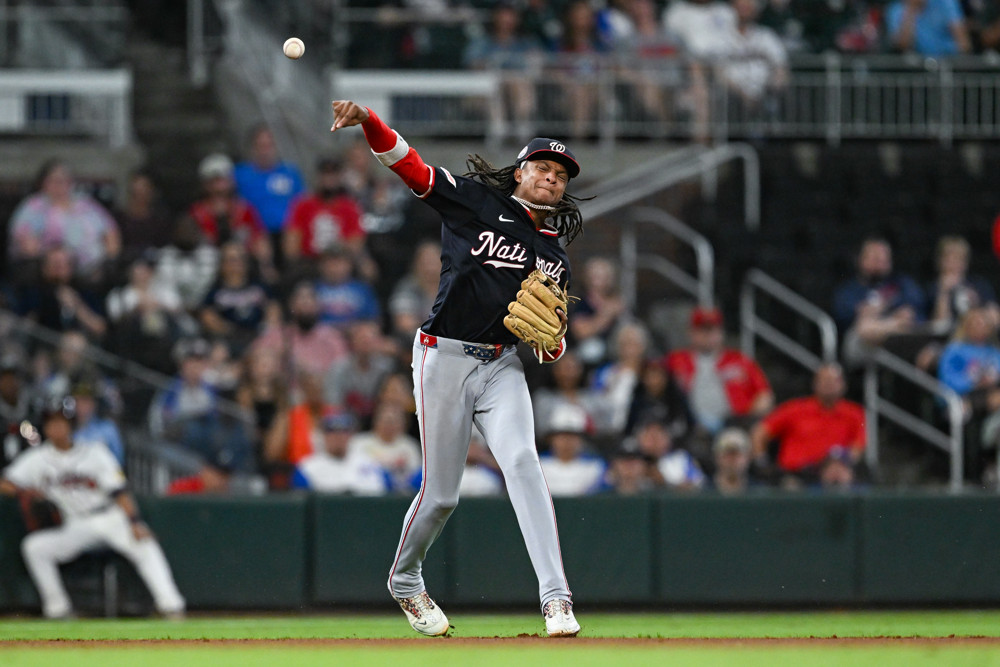
Here’s one Arraez example, a softly-hit ground ball hit by Vladimir Guerrero Jr. on which the out probability went from 51% to 83% because of where Arraez was located.
And then at third base, Jean Segura has gotten the largest share of playing time but here’s a ball hit to Jon Berti, a 103-mph grounder by Andrew McCutchen where Berti’s positioning boosted the out probability from 50% to 88%.
This is Reed’s first season with the Marlins after a long career coaching in the minor leagues. He played nearly 1,300 games as an infielder for five teams from 1987 to 1997. He acknowledged to being a traditionalist and pointed out that teams have been using spray charts for a long time. But they’ve gotten more precise over time. And right now, they’re one of many things working well for the Marlins.
“I’m a believer,” said Reed. “I’ve seen how accurate it is.”