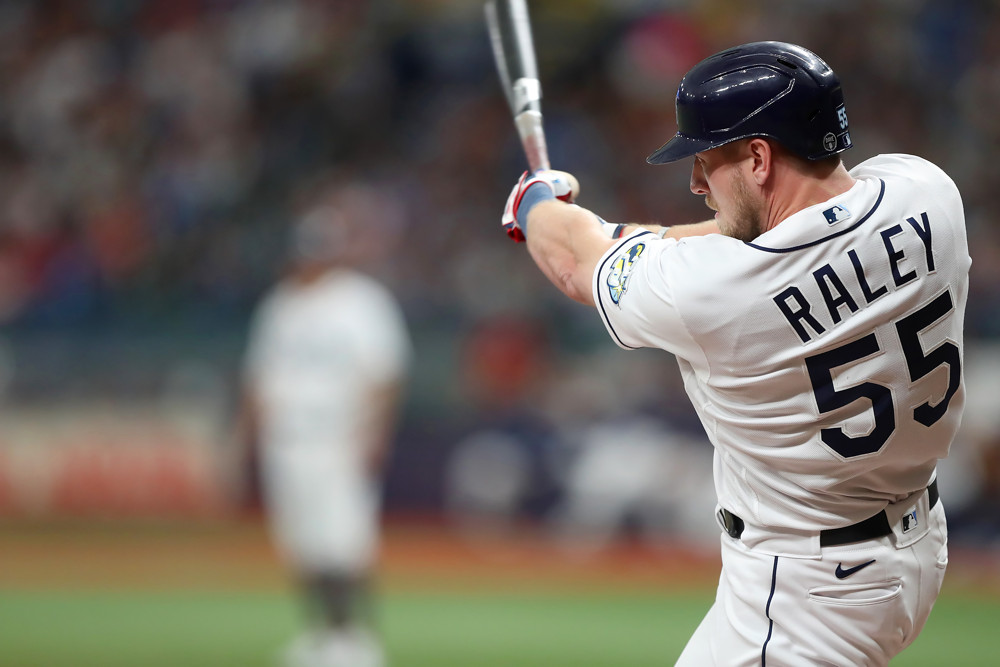
Photo: Cliff Welch/Icon Sportswire
BY MARK SIMON
Luke Raley missed on 36% of his swings last season, the 4th-highest rate of any player with at least 250 plate appearances last season.
So in order for Raley to be a productive major league hitter, he had to get the most out of the swings on which he did make contact.
And he did.
Raley, traded by the Rays to the Mariners last week, produced a .330 BABIP, a .249 batting average, .490 slugging percentage, and .823 OPS in 2023.
But by our measures, he overachieved.
A brief point of explanation:
Sports Info Solutions tracks its own version of a player’s expected stats (similar to what you can find on Baseball Savant). Rather than basing a player’s hit probability (and subsequently single, double, triple, and home run probability) on a batted ball’s exit velocity and launch angle, SIS’ version estimates probabilities based on where balls are hit, how hard they are hit, and how long they spend in the air.
This allows us to compare a player’s actual stats to his expected stats.
Raley had the biggest differential between his actual OPS and his expected OPS of any player with at least 250 plate appearances last season. He tallied an .823 OPS against an expected OPS of .700.
Biggest Differential – 2023 OPS and Expected OPS
Minimum 250 Plate Appearances in 2023
| Player | OPS | Expected OPS | Differential |
| Luke Raley | .823 | .700 | .123 |
| Brandon Belt | .859 | .742 | .117 |
| Adam Duvall | .834 | .721 | .113 |
| Aaron Hicks | .738 | .631 | .107 |
| Brandon Marsh | .828 | .728 | .100 |
| Ryan Jeffers | .859 | .759 | .100 |
| Jason Heyward | .813 | .715 | .098 |
| Ryan O’Hearn | .802 | .705 | .097 |
An .823 OPS makes Raley a well above-average offensive player. A .700 OPS (his expected number) would be below MLB’s average OPS in 2023 (.734).
Here’s what Raley’s 2023 batting line looked like compared to his expected batting line.
| BA | SLG | BABIP | Doubles | Home Runs | |
| Actual | .249 | .490 | .330 | 23 | 19 |
| Expected | .210 | .401 | .264 | 15 | 16 |
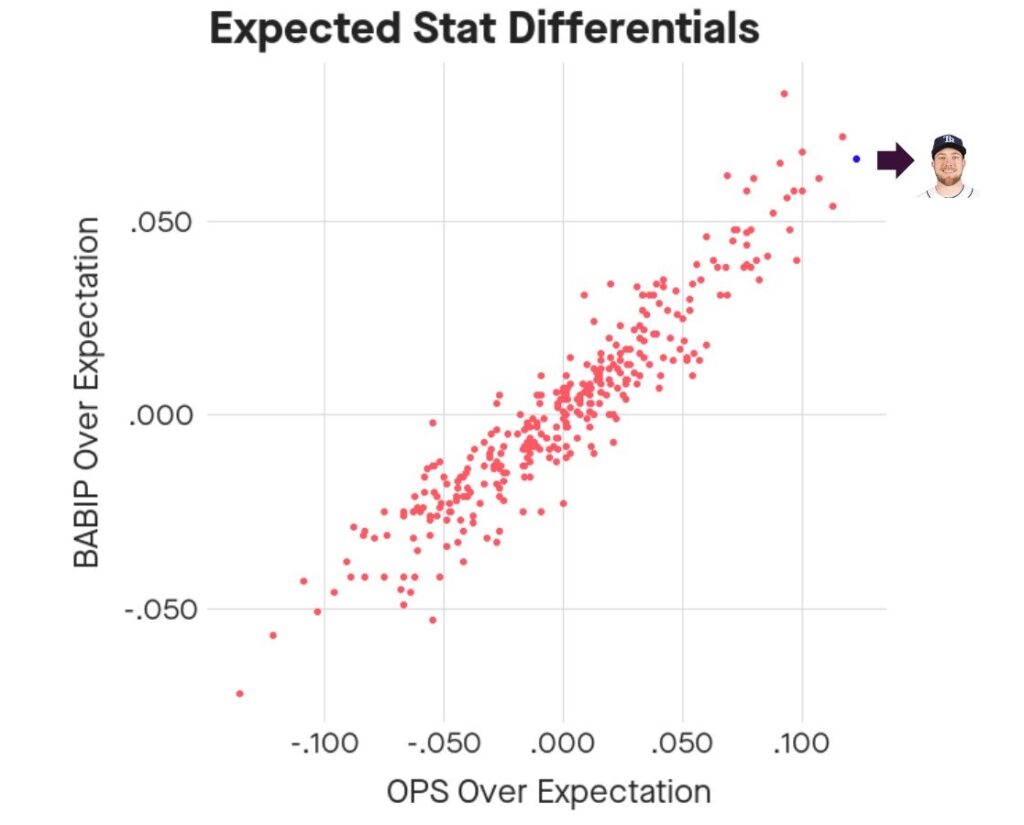
And here’s another perspective on Raley’s outlier status. This graph shows the range of outcomes in expected BABIP differential and expected OPS differential. Raley is the blue dot in the upper right of the graph.
As far as examples of Raley’s overachieving go, here are two balls that Raley hit against the Mariners last season (click here and here). The first is a double, one with a 30.5% hit probability. The other is a home run with a 19% home run probability.
A player can outperform his expected OPS for a number of reasons. Luck can be a part of it (we found multiple examples of Raley hitting doubles that were barely fair) but there are other factors too. A player’s other skills can play a role. For example, in Raley’s case, a look at video showed that his speed allowed him to leg out a few unexpected hits.
Another factor could be a player’s home ballpark providing dimensions that are friendly to that hitter. Raley did not play in a particularly hitter-friendly park (Tropicana Field). Something like this is more applicable for another player on this list, Adam Duvall, and how well he hit at Fenway Park last season (.596 slugging, .933 OPS).
We’re not necessarily saying that Raley will fall back to the pack this season (though the Steamer projection on FanGraphs assesses that he will). We’re just pointing out that it would be difficult for an average player to put up Raley’s line given the distribution of his batted balls and his strikeout rate.
We’ll look at 2023’s underachievers in the near future.