Photo: Brandon Sloter/Icon Sportswire
Introduction
While many crave all the NFL Draft Team Grades that publications put out the day after the draft, including us on both accounts, there are a lot of unknowns at that point. Of course, we all have our own NFL Draft prospect rankings heading into that weekend, but those players have yet to play a snap in the NFL. So, how can we really grade a team’s draft class if those players haven’t yet stepped onto an NFL field?
It usually takes at least three years to see how well a draft class turned out. While said publications, including us, don’t want to wait three years before putting out their grades on a draft class, we do both. This is the time that teams must decide on 5th-year options for their 1st-round picks. Additionally, this gives these players a rookie season and two full years after that to get settled in and playing time under their belt.
Three years ago, Sports Info Solutions published our very first NFL Draft website. After three years in book form, we moved our reports, articles, stats, leaderboards, and team pages onto the web for the first time. After the 2022 NFL Draft, we, just as many others, posted our NFL Draft Team Grades, which can be seen here. It’s worth noting we don’t give out letter grades like most. We rank the teams from 1 to 32 in terms of how much talent they got as an entire class based on our pre-draft player grades.
Just as I did last year, in the article you can see here, I’ve developed a system to evaluate the draft classes using Total Points relative to position as the foundation. Three seasons have now gone by since the 2022 NFL Draft. So, let’s use that to truly see how each team did with getting value from its selections and draft class as a whole.
Our TLDR Top Things to Know
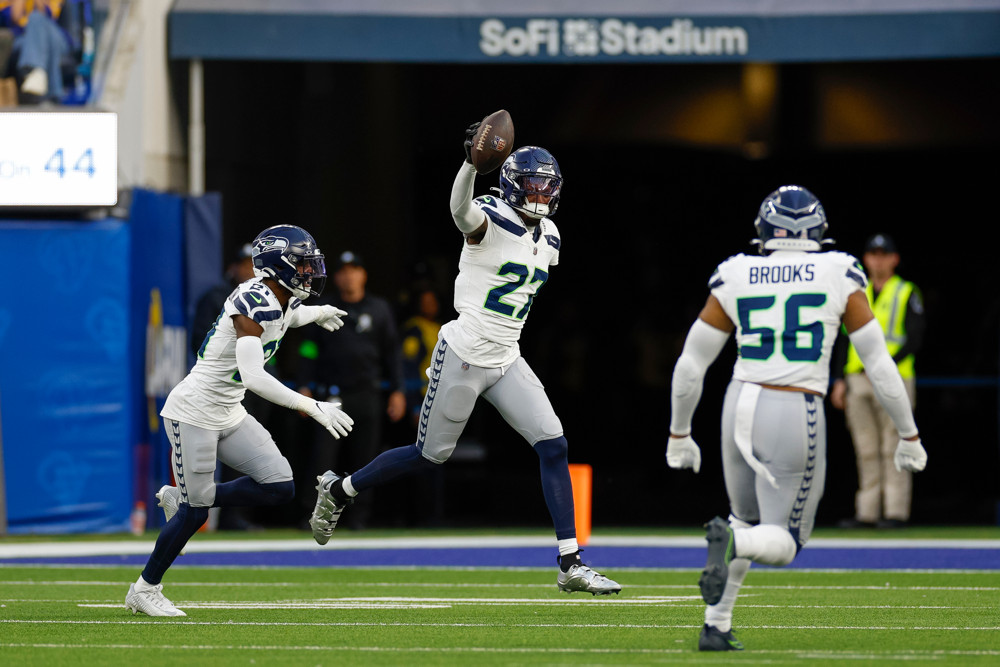
- We ranked the Jets No. 1 in our 2022 post-draft ranking. Three years later, the Seahawks rank No. 1 according to our stat for assessing it, Total Points Score (TP Score), followed by the Jets, Cowboys, Lions, and Packers.
- The Dolphins ranked last both in our original rankings in 2022 and in TP Score three years later.
- The Seahawks, Packers, and Chiefs accrued the most raw Total Points from their draft classes.
- Brock Purdy, Kerby Joseph, and Kyle Hamilton were top 3 in Total Points across the past three seasons.
How much value did teams get?
Let’s take a look at how we ranked teams after the 2022 NFL Draft and then who got the most and least value. See the Appendix at the bottom to see how all 32 teams ranked in our 2022 rankings and in TP Score.
Here are the teams we ranked at the top immediately following the draft back in 2022. To see our scouting grading scale, check out our NFL Draft site.
| Top 5 Teams in 2022 Post-Draft Rankings | ||
| Team | Book Rank | Grade |
| Jets | 1 | 6.53 |
| Eagles | 2 | 6.46 |
| Lions | 3 | 6.45 |
| Ravens | 4 | 6.43 |
| Panthers | 5 | 6.40 |
TP Score will be defined below, but here are the top 5 teams based on how much value they received from their draft class.
| Top 5 Teams in TP Score | ||
| Team | TP Rank | TP Score |
| Seahawks | 1 | 76.67 |
| Jets | 2 | 75.43 |
| Cowboys | 3 | 66.96 |
| Lions | 4 | 66.00 |
| Packers | 5 | 64.54 |
In our post-draft rankings in 2022, we tabbed the Jets as the No. 1 draft class, and they just got edged out by the Seahawks for No. 1 three years later. The Jets drafted the two Rookies of the Year in Garrett Wilson and Sauce Gardner, not to mention adding Jermaine Johnson, all in the 1st round.
While we felt the Seahawks drafted a strong class post-draft, we ranked them 7th, we were a little low on Riq Woolen (6.4) and Abraham Lucas (6.3) compared to how they performed. Not only did the Seahawks accumulate the best TP Score, they also had the most raw Total Points among the class with 414.
|
Seattle Seahawks |
|||
| Player | College | Grade | Total Points 2022-2024 |
| OT Charles Cross | Mississippi State | 6.9 | 67 |
| ED Boye Mafe | Minnesota | 6.6 | 73 |
| RB Kenneth Walker III | Michigan State | 6.6 | 79 |
| OT Abraham Lucas | Washington State | 6.3 | 45 |
| CB Coby Bryant | Cincinnati | 6.7 | 45 |
| CB Riq Woolen | UTSA | 6.4 | 97 |
| ED Tyreke Smith | Ohio State | 5.9 | 0 |
| WR Bo Melton | Rutgers | 5.9 | 6 |
| WR Dareke Young | Lenoir-Rhyne | 5.8 | 2 |
We also had the Lions in our top 5, and they ended up there again three years later. Despite a midseason injury in 2024, Aidan Hutchinson has been dominant and has only continued to improve each year he’s been in the league. Additionally, drafting Kerby Joseph in the 3rd round was arguably one of the biggest steals of the draft. His 136 Total Points over the past three seasons was 2nd-most overall and most among all non-QBs. It’s easy to see how the Lions are up here after drafting two players who were top 5 in Total Points.
As for the Cowboys, we were high on Tyler Smith (SIS No. 5 OT), Damone Clark (SIS No. 2 MLB), and Jalen Tolbert (SIS No. 16 WR), as all received 6.4 or above grades from us, but Sam Williams (33 TP), Jake Ferguson (51 TP), DaRon Bland (91 TP), and John Ridgeway (20 TP) were also above-average players and big-time contributors who we had graded as backups.
The Packers rounded out the top 5 in TP Score with the 2nd-most raw Total Points (411). We ranked them 12th immediately following the 2022 Draft, having given 6 of their 11 picks a 6.3 grade or better. However, we were a little lower on Romeo Doubs (SIS No. 32 WR) and Zach Tom (SIS No. 16 OT), who combined for 97 Total Points.
Conversely, here are the bottom 5 teams from our 2022 rankings.
| Bottom 5 Teams in 2022 Post-Draft Rankings | ||
| Team | Book Rank | Grade |
| 49ers | 28 | 5.98 |
| Buccaneers | 29 | 5.94 |
| Colts | 30 | 5.90 |
| Rams | 31 | 5.86 |
| Dolphins | 32 | 5.80 |
Based on TP Score, here are the worst teams in terms of getting value from their 2022 draft picks.
| Bottom 5 Teams in TP Score | ||
| Team | TP Rank | TP Score |
| Rams | 28 | 23.13 |
| Panthers | 29 | 19.44 |
| Raiders | 30 | 14.97 |
| Vikings | 31 | 13.97 |
| Dolphins | 32 | 1.50 |
The big bullseye here was the Dolphins. We were very low on their draft class initially, and they haven’t done anything to disprove that. Even though they had only four picks in the draft, and none until late in Round 3, only one of them was one we had graded above a 5.8. We graded Channing Tindall a 6.6, but he has only accumulated 1 Total Point in the past three seasons, as he’s hardly played any defense and mainly been a special teams player. Erik Ezukanma was our top 5.8 receiver (SIS No. 36 WR) and has only 2 Total Points. Their other two picks we didn’t have on the site and have combined for 3 Total Points. So, the grand total for Miami’s draft class was 6 Total Points.
While we ranked the Rams (31st) low initially, we were a little off on the Raiders (17th) and Vikings (19th) and completely missed on the Panthers (5th).
The Panthers have gotten 100 Total Points from their six draft picks. Ikem Ekwonu (SIS No. 3 OT) and Cade Mays (SIS No. 6 OG) have been about what we expected, but they haven’t gotten much of anything from the rest of their class, especially Amare Barno (SIS No. 14 ED), who only has 8 Total Points despite our 6.5 starting grade.
Determining Total Points Score
In case you missed previous articles, let’s explain the process of creating each team’s TP Score. When looking back to see how good or bad a specific draft class was, there are two main points to detect:
- How productive were the draft picks on the field?
- How much talent did the team draft relative to the amount of picks they made?
As in: Did they hit on one player or did they hit on multiple players?
To determine the value of the draft classes, I used Total Points, our flagship player value stat, from across the last three seasons. However, for those of you who are familiar with Total Points, it gives a lot of extra weight to quarterbacks. With that said, Brock Purdy alone would have had the 17th-best draft class with his 195 Total Points if we just used raw Total Points.
While there is a reason we weigh quarterbacks so much more compared to other positions (they are pretty important), using that raw number in this sense isn’t going to make for a perfect match. While getting your franchise quarterback is a huge win, especially with the last pick of the draft, it doesn’t automatically give you a top class. This year, San Francisco ended up 18th in TP Score, and I think most would agree they had an average-at-best class aside from Purdy.
Answering question 2 takes into account how well a team drafted throughout the entirety of the draft class. I found the average Total Points per player from the 2022 class at each position, including UDFAs who have taken at least one offensive or defensive snap, since they were also available to be selected.
The positional averages are shown in the table below.
| Pos | TP per Player |
| QB | 36.4 |
| RB | 12.3 |
| WR | 12.1 |
| TE | 15.3 |
| OL | 27.1 |
| DE | 22.1 |
| DT | 7.1 |
| LB | 17.6 |
| CB | 35.9 |
| S | 29.3 |
The TP Score, as referenced earlier, is what’s used to rank the teams. It is calculated as follows:
- Add up the Total Points from the entire team’s draft class
- Divide that number by the number of selections the team had
- Multiply that number by the percentage of draft picks that were above the average Total Points for their given position
- Add that to the original Total Points per draft pick
In these 4 steps, we are essentially answering how productive the draft class was and how many picks were “hits”. Let’s run through an example using our No. 2 team, the New York Jets.
Here is their draft class:
| Pos | Player | Total Points |
| CB | Sauce Gardner | 112 |
| WR | Garrett Wilson | 53 |
| DE | Jermaine Johnson | 45 |
| RB | Breece Hall | 41 |
| TE | Jeremy Ruckert | 10 |
| OL | Max Mitchell | 17 |
| DE | Micheal Clemons | 30 |
Add up the Total Points from the entire team’s draft class
308
Divide that number by the number of selections the team had
308 Total Points divided by 7 selections equals 44.00
Multiply that number by the percentage of draft picks that were above the average Total Points for their given position
Gardner, Wilson, Johnson, Hall, and Clemons all accumulated a Total Points number that was above average compared to their position groups
44.00 times 71.4% (5 out of 7) equals 31.43
Add that to the original Total Points per draft pick
44.00 plus 31.43 equals 75.43, which is their TP Score
So, to summarize, we took the team’s Total Points gained from these players, dispersed it throughout the entire class and then gave a bump based on how many above-average players they drafted.
Now that we know how the teams ranked and how the TP Score is calculated, let’s dive into some of the other details.
Other Key Takeaways
– The Cowboys and Eagles hit on at least 75% of their picks in 2022. Dallas hit on 7 of 9 picks, while Philadelphia hit on 4 of 5. Interestingly enough, none of the three players who weren’t hits among the teams accumulated any Total Points. Additionally, the Packers, Giants, and Jets get shoutouts for being just under 75%. The Packers and Giants hit on 8 of their 11 picks, while the Jets hit on 5 of their 7.
– The Packers and Giants having eight hits were the most of any team. The Packers ranked 5th in TP Score and the Giants ranked 11th. Both were top 7 in raw Total Points. Of Green Bay’s eight hits, all but 1 had more than 32 Total Points, suggesting massive contribution from their draft class. Funny enough, the same can almost be said for the Giants, as only one hit was under 31 Total Points. The kicker in the difference between these two teams is that the Packers had four players with 56+ Total Points, while the Giants only had two.
– The Dolphins were the only team to not draft at least one player who has played above the positional average compared to the rest of the draft class. Additionally, the Vikings drafted only 1 in their 10 picks and the Raiders had just 1 in their 6 selections. Furthermore, in addition to Miami (Channing Tindall) and Buffalo (Kaiir Elam), the Vikings (Lewis Cine), 49ers (Drake Jackson), Rams (Logan Bruss), and Titans (Treylon Burks) were the only teams whose first draft selection wasn’t an above-average player. This is now the third year in a row that’s been the case for Tennessee and Los Angeles.
– The three teams with the most raw Total Points are the Seahawks (414), Packers (411), and Chiefs (408). It’s funny how things change, as Seattle accumulated the least amount of Total Points with their 2021 class. Green Bay and Kansas City ranked 5th and 6th, respectively. We detailed Seattle and Green Bay already, so for the Chiefs, they hit a huge home run with Trent McDuffie (SIS No. 3 CB), in addition to getting huge contributions from George Karlaftis (SIS No. 4 ED), Bryan Cook (SIS No. 7 S), Leo Chenal (SIS No. 3 MLB), and Jaylen Watson (SIS No. 41 CB). That’s not to mention Joshua Williams (SIS No. 28 CB), whose 34 Total Points actually just missed the average in a deep cornerback class.
– The Dolphins (6), Raiders (77), and Panthers (100) totaled the least amount of Total Points from their draft class. For Las Vegas, it received 73 of their 77 Total Points from Dylan Parham (SIS No. 4 OG), their first selection. Thayer Munford (SIS No. 9 OG) did get 21 Total Points, but Zamir White (SIS No. 5 RB) has been a huge disappointment, accumulating -19 Total Points during his time.
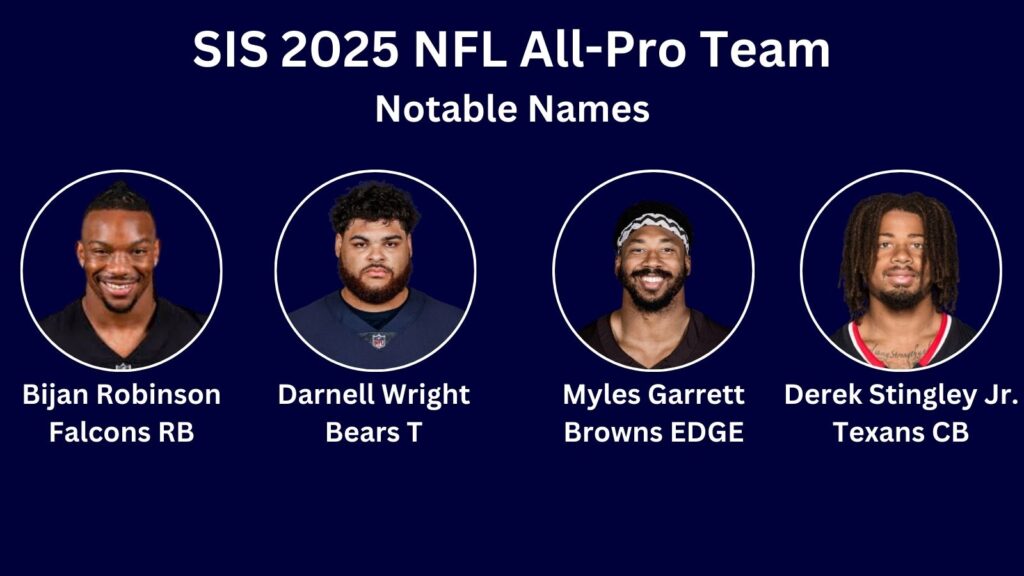
– Of the 18 players whose options were picked up, minus Derek Stingley Jr. since he received an extension, the only two who didn’t rank in the top 8 of their position group among the class were Ikem Ekwonu, whose 65 Total Points placed him 10th among offensive linemen, and Daxton Hill, whose 44 Total Points placed him 11th among safeties.
How do our Initial Grades Compare?
75% (24/32) of our initial ranks were in the correct half, meaning a team we ranked between 1 and 16 or 17 and 32 was ultimately in that tier, which is a huge success compared to last season and our best percentage ever. Not only did we get three direct hits, 12 teams were within three spots and 24 teams were only a single-digit difference from post-draft to now.
The biggest differences in our initial grades and these final rankings were the Panthers (24 spots), Cowboys (17 spots) and Colts (17 spots). While we were way too high on Carolina post-draft, as previously mentioned, we were far too low on Dallas and Indianapolis. We had the Cowboys 20th post-draft and they ended up 3rd, whereas the Colts were initially ranked 30th and ended up 13th.
For Indianapolis, Bernard Raimann (SIS No. 6 OT) and Alec Pierce (SIS No. 12 WR) were the only players we graded above a 5.9. We missed on including Rodney Thomas II and Drew Ogletree on the site at all, as they combined for 73 Total Points. Additionally, we graded Nick Cross (SIS No. 19 S) as a 5.8 backup, but he’s accumulated 59 Total Points himself.
Some other players we unfortunately omitted from the site were Christian Benford, Kader Kohou, and Tony Adams. Benford’s 93 Total Points is tied for 6th-most among CBs in big-time CB class and not too far outside the top 10 overall. Kohou and Adams each have accumulated 90 and 64 Total Points, respectively.
What were some of our biggest misses elsewhere? Brock Purdy is one of the biggest names in the class. While he’s a bit of an anomaly as the last selection in the draft, we graded him as a 5.8 and the 10-best QB in the class, yet he led all 2022 draftees in Total Points. Additionally, Martin Emerson Jr. was our 37th-ranked CB, but his 103 Total Points put him in the top 10.
Let’s take a look at some of our biggest wins.
Four of our top 5 safeties going into the draft ended up top 5 in Total Points at the position, with only Daxton Hill (SIS No. 3 S) missing out and Reed Blankenship (SIS No. 28 S) in his place. Additionally, Rasheed Walker (SIS No. 7 OT), who was drafted in the 7th round, has accumulated 56 Total Points for the Packers which is 13th-best among all OL.
Tyquan Thornton was our 27th-ranked WR and was drafted in the 2nd round, but has only 12 Total Points in 28 games. Velus Jones Jr. (SIS No. 25 WR) was drafted in the 3rd round and has just 3 Total Points in 29 games. JT Woods, our 30th-ranked safety, was also drafted in the 3rd round and has only accumulated 1 Total Point in 13 games. Finally, Montrell Washington, who was the first non-ST player drafted that we didn’t get a formal look on, was drafted in the 5th round and has just 1 Total Point in 22 games, primarily as a returner on special teams.
The table below shows the top Total Points earners across the past three seasons from the draft class and how we graded and ranked them on our site pre-draft.
| Rank | Position | Player | Total Points | SIS Grade | SIS Pos Rank |
| 1 | QB | Brock Purdy | 195 | 5.8 | 10 |
| 2 | S | Kerby Joseph | 136 | 6.7 | 5 |
| 3 | S | Kyle Hamilton | 120 | 7.0 | 1 |
| 4 | DE | Aidan Hutchinson | 116 | 7.0 | 1 (ED) |
| 5 | CB | Derek Stingley Jr. | 115 | 6.9 | 1 |
| 6 | CB | Trent McDuffie | 113 | 6.8 | 3 |
| 7 | CB | Sauce Gardner | 112 | 6.8 | 2 |
| 8 | CB | Martin Emerson Jr. | 103 | 5.8 | 37 |
| 9 | C | Tyler Linderbaum | 97 | 6.8 | 1 |
| 10 | CB | Riq Woolen | 97 | 6.4 | 14 |
As mentioned before, we were a bit low on Purdy, Emerson, and Woolen. However, the other seven were in our top 5 at the position, including our top 3 cornerbacks. It’s easy to see why the Lions and Ravens ranked so high in TP Score and in our post-draft rankings, as each has two players on this list. That’s not to mention each of our top 2 in TP Score, the Seahawks and Jets, having a player here as well.
Conclusion
Nobody really knows how a draft class is going to turn out immediately after the draft, yet it still makes sense to grade and/or rank the teams based on player grades for an initial reaction.
Post-draft grades are great in a sense, but they should be taken with a grain of salt. Once three years go by and we’ve seen what these players have done in the NFL, we can get a better sense of how good the team drafted.
These rankings are all about finding which teams drafted the best draft class as a whole, not just who got the best player. While there are some players who didn’t play for the team that drafted them for the entirety of the past three seasons, that wasn’t taken into account since those decisions came after the initial drafting of these players, which is what this is based on.
An example of that from this class is Jack Jones. He was drafted by the Patriots and has 93 Total Points, but played only 18 games and 575 snaps for them across 2022 and part of 2023 before playing 24 games and nearly 1,400 snaps across the past season and a half for the Raiders, where he had five interceptions and three pick-sixes.
It’s not a perfect science, but it does a good job at pulling player value and seeing how well teams drafted as a whole class relative to the amount of selections they were afforded.
Three years later, the comparison between our initial rankings and these rankings are the best they’ve ever been (in both our grading and our scouting process). Considering this was the first year of our new website, we were afforded more time during the draft process. Previously, the Handbook was completed by the end of January, so we didn’t have the luxury of factoring in Combine or Pro Day results. Having a website allowed us to also spend February, March, and April finalizing these reports and grades and using all the data available up to the draft to be sure they were the best they could be. With that extra time, we were able to add 92 more players to the site for a total of 410 compared to just 318 in 2021. That also allowed us to get 8 more players featured on the site who were drafted.
We hope this article next year continues to show the growth we made in Year 2 of our website and Year 5 overall. As with everything we do here, we hope this improves year over year and can look back and say we kept getting better every day.
Appendix
2022 SIS Post-Draft Rankings based on the SIS NFL Draft site
| Site Rank | Team | Grade |
| 1 | Jets | 6.53 |
| 2 | Eagles | 6.46 |
| 3 | Lions | 6.45 |
| 4 | Ravens | 6.43 |
| 5 | Panthers | 6.40 |
| 6 | Texans | 6.38 |
| 7 | Seahawks | 6.34 |
| 8 | Falcons | 6.30 |
| 9 | Jaguars | 6.30 |
| 10 | Saints | 6.30 |
| 11 | Giants | 6.28 |
| 12 | Packers | 6.27 |
| 13 | Chiefs | 6.27 |
| 14 | Bengals | 6.23 |
| 15 | Commanders | 6.19 |
| 16 | Titans | 6.17 |
| 17 | Raiders | 6.15 |
| 18 | Patriots | 6.14 |
| 19 | Vikings | 6.10 |
| 20 | Cowboys | 6.10 |
| 21 | Browns | 6.09 |
| 22 | Cardinals | 6.08 |
| 23 | Bears | 6.05 |
| 24 | Bills | 6.04 |
| 25 | Broncos | 6.02 |
| 26 | Steelers | 6.01 |
| 27 | Chargers | 6.00 |
| 28 | 49ers | 5.98 |
| 29 | Buccaneers | 5.94 |
| 30 | Colts | 5.90 |
| 31 | Rams | 5.86 |
| 32 | Dolphins | 5.80 |
TP Rank based on TP Score and how much value each team got from their draft picks over the last three seasons
| Team | TP Rank | TP Score |
| Seahawks | 1 | 76.67 |
| Jets | 2 | 75.43 |
| Cowboys | 3 | 66.96 |
| Lions | 4 | 66.00 |
| Packers | 5 | 64.54 |
| Chiefs | 6 | 61.20 |
| Ravens | 7 | 54.37 |
| Eagles | 8 | 54.00 |
| Bills | 9 | 53.81 |
| Saints | 10 | 53.44 |
| Giants | 11 | 50.88 |
| Jaguars | 12 | 49.80 |
| Colts | 13 | 48.14 |
| Buccaneers | 14 | 45.38 |
| Texans | 15 | 42.05 |
| Bengals | 16 | 41.75 |
| Falcons | 17 | 41.06 |
| 49ers | 18 | 39.52 |
| Steelers | 19 | 36.73 |
| Chargers | 20 | 32.83 |
| Bears | 21 | 28.69 |
| Commanders | 22 | 26.06 |
| Cardinals | 23 | 25.71 |
| Titans | 24 | 25.63 |
| Patriots | 25 | 24.18 |
| Browns | 26 | 24.15 |
| Broncos | 27 | 23.26 |
| Rams | 28 | 23.13 |
| Panthers | 29 | 19.44 |
| Raiders | 30 | 14.97 |
| Vikings | 31 | 13.97 |
| Dolphins | 32 | 1.50 |