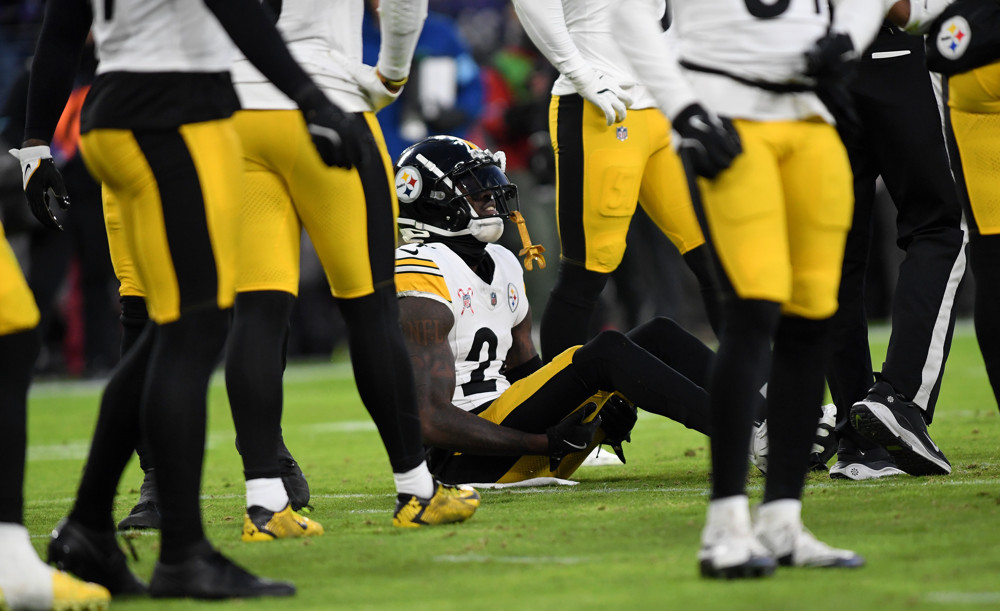
Injuries. Everyone hates them, and we all can agree injuries are the worst part of sports.
Part of the reason is that injuries can occur when you least expect them, and there are so many different variables that can come into play for why they happen, making it very difficult to accurately predict them. Unfortunately we cannot just turn injuries off like we are playing a game of Madden, and so there can be great value in trying to provide something to base expectations off in terms of how much time a player misses. With our multi-year injury risk model, we aimed to do just that.
Methodology
Football can vary greatly depending on what position you play, and so we split our player dataset into three different position groups: offensive skill players, offensive linemen, and defensive players. We also wanted to test various time frames, so we made predictions for the number of games players will miss in one-, two-, and three-year spans. Features incorporated in our dataset include biographical data, injury history data, playing time data, and other stats that convey what the player does on the field.
We used the XGBoost machine learning framework to build our regression model. For our target variable, to lessen the impact of outlier cases, we took the average of the number of games missed in the next year (or two or three) and the number of games the player was expected to miss based on the injury prognosis (which is something that our injury staff logs for most injuries).
Findings
Games Missed Prediction Error by Position Group and Timeframe
| One Year | Two Years | Three Years | |
| Offensive Skill Players | 3.6 | 5.9 | 7.1 |
| Offensive Linemen | 3.7 | 5.3 | 7.3 |
| Defensive Players | 3.7 | 6.2 | 7.3 |
Root mean squared error (RMSE) was used to evaluate the accuracy of our model. As we can see above, overall, the accuracy is similar across positions, with accuracy predictably being better the shorter the time frame is. However, it can also be argued that the three-year model was the most accurate because when you divide the RMSE by the number of games corresponding to that time frame (i.e. 17 games in one year, 51 games in three), the ratio is smallest for the three-year interval. Therefore, the model predicted games missed for the longest time span with the least error percentage-wise.
Average Predicted Games Missed by Position Group and Timeframe
| One Year | Two Years | Three Years | |
| Offensive Skill Players | 2.2 | 5.2 | 7.7 |
| Offensive Linemen | 2.4 | 6.4 | 8.2 |
| Defensive Players | 2.1 | 4.6 | 6.4 |
We observe more of a discrepancy across position groups when examining the average predicted games missed. For all three time intervals, offensive linemen were predicted to miss the most games, followed by offensive skill players, and then lastly the defensive players. This is in line with the trend for actual games missed by position group.
Top 10 Feature Importances by Position Group
Here are the top 10 features in terms of importance (how much a feature contributes to a model’s predictions) by position group for the three-year interval.
| Offensive Skill | Offensive Linemen | Defensive | |
| 1. | Snap % in the Slot | Snap % Playing Tackle | Age |
| 2. | Snaps Blocking | Projected Snaps | Total Points per Snap |
| 3. | Age | Games Missed Past Year | Projected ST Snaps |
| 4. | Total Points per Snap | Blown Block % | Snap % Playing Linebacker |
| 5. | Special Team Snaps | Total Points per Snap | Special Team Snaps |
| 6. | Snaps in Motion | BMI | Projected Snaps |
| 7. | Projected Snaps | Snaps on Pass Plays | Snap % Playing Run Defense |
| 8. | Routes Run | Age | Snap % Pass Rushing |
| 9. | Games Missed Past 3 Years | Games Missed Past 3 Years | BMI |
| 10. | Snaps Player was Hit | Snap % Playing Guard | Tackles Made |
We can see that projected snaps and age were among the most significant for each position group. To dive deeper into why, we ran a comparative analysis between players in the top half of predicted games missed and players in the bottom half.
Comparison of Key Features for Skill Position Players, by Predicted Games Missed
The table below shows an example of one of our datasets, skill players in a two-year time span.
| High Prediction | Low Prediction | |
| Predicted Games Missed, Two Years | 6.1 | 4.4 |
| Snaps Played Past Season | 835 | 554 |
| Projected Snaps Next Two Years | 1,503 | 1,045 |
| Age | 26.6 | 27.4 |
We can observe that on average, players who are predicted to miss more games have played more snaps in the previous season, are projected to play more snaps the next two years, and are about a year younger than players who are predicted to miss less games.
This pattern was more or less present across all our datasets. At first, this may seem counterintuitive. One could think that older players are more injury prone or that players are projected to play less because they got hurt. However, the data is telling a different story; players are predicted to miss more games when they are expected to also play more games. Playing football is itself a hazard.
One place where this trend reverses is at the very end of a career. Among the 1,700 players we made predictions for 2025 and beyond, about two dozen players were predicted to miss more games in a two-year period than in a three year one, a finding that was quite confounding at first. However, when comparing these players to the rest of the population, an even larger discrepancy in age existed, with them being three years older on average than their counterparts. The model was picking up signals for when a player was close to retirement and inferring reduced playing time over a three-year span. For these cases, we adjusted the number of predicted games missed in three years to be equal to the two-year number.
We observed more trends when taking a look at who our model predicted to miss the most games.
Top 10 Players Predicted to Miss the Most Games Over a Three Year Span
| Player | Position | One Year | Two Years | Three Years |
| Kamari Lassiter, HOU | CB | 4.0 | 8.7 | 14.6 |
| Rashawn Slater, LAC | OT | 3.5 | 9.1 | 13.7 |
| Paulson Adebo, NYG | CB | 4.4 | 8.1 | 13.6 |
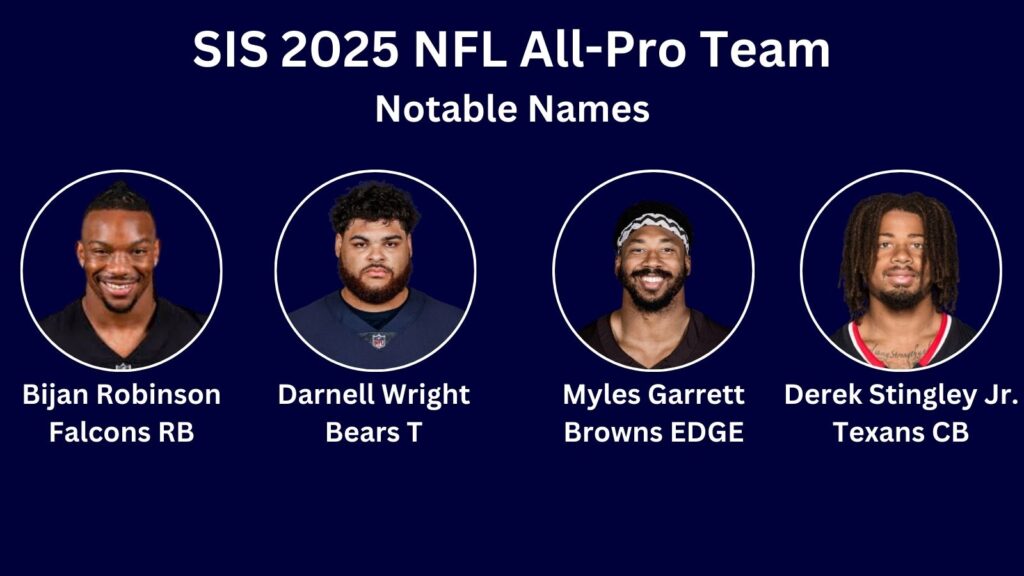
| Derek Stingley Jr., HOU | CB | 3.4 | 8.3 | 13.3 |
| Dalton Kincaid, BUF | TE | 3.3 | 9.5 | 12.9 |
| Kyle Pitts, ATL | TE | 2.3 | 7.0 | 12.9 |
| Luke Goedeke, TB | OT | 3.7 | 9.1 | 12.8 |
| Pat Freiermuth, PIT | TE | 2.8 | 8.5 | 12.8 |
| Alaric Jackson, LAR | OT | 3.0 | 7.8 | 12.6 |
| Jake Ferguson, DAL | TE | 3.2 | 8.1 | 12.6 |
First, every player was drafted in 2021 or later, keeping in line with the propensity of our model to predict younger players missing more games than older players (in large part because younger players are on the field more).
Second, all players had sustained a multi-week injury at some point during the last three years. Indeed, though not as prevalent as the other key features, missed games in past years were greater on average for players in the top half of predictions than for those in the bottom half.
Lastly, within the three position groups, our model predicted tight ends, offensive tackles, and cornerbacks to be more prone to injury, and accordingly, everyone on this list plays one of those positions.
Conclusion
While attempting something as inherently difficult as predicting the number of games a player will miss due to injury in a given time frame may seem like a lemon that is not worth the squeeze, our study shows there is value in going through the exercise and extracting inferences from the data. Chief among them is that the more a player is on the field, the more he invites risk of getting injured.
This is a simple premise, but one that is often more overlooked than it should be, and emphasizes even more just how much we should appreciate players who exhibit extraordinary durability.


