Sports Info Solutions
Category: John Dewan’s Stat of the Week
-

Stat of the Week: Albert Pujols Finishing With A Flourish
By
This recent remarkable stretch that Pujols is on makes us think about his all-around excellence.
-
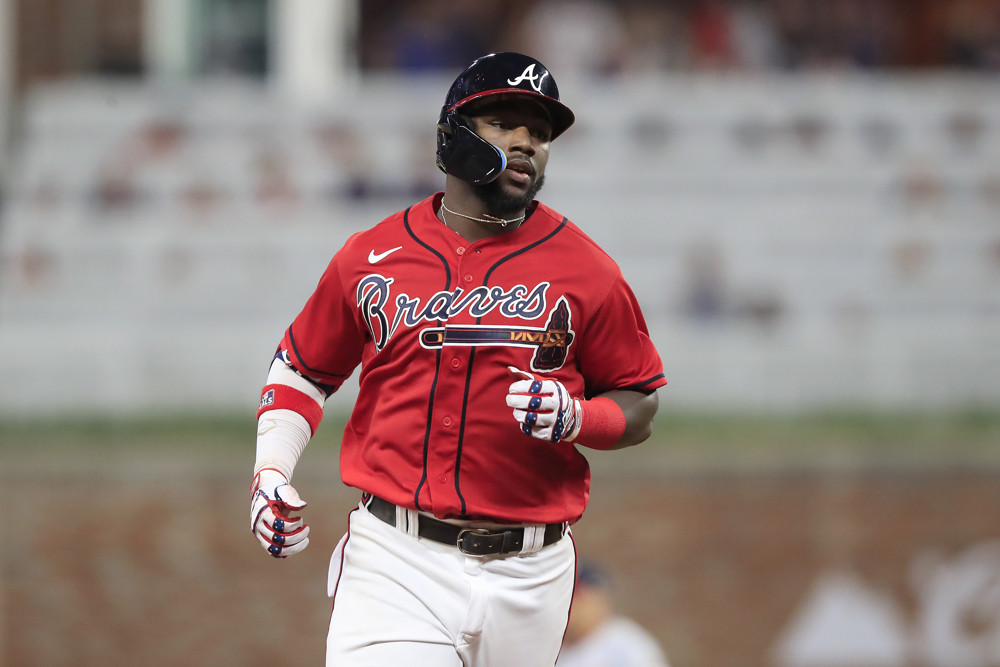
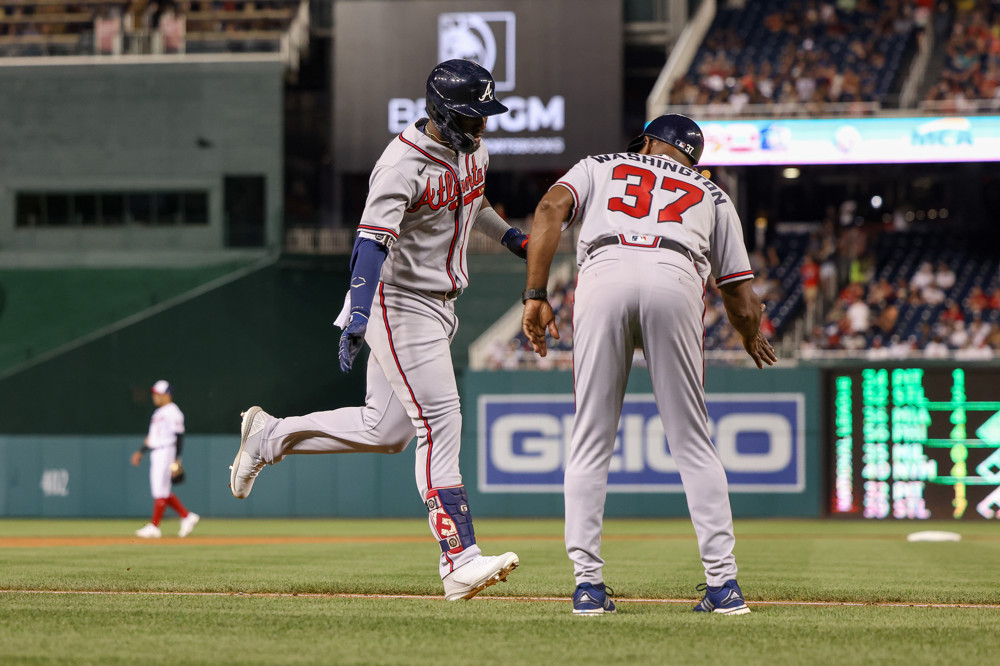
Stat of the Week: Michael Harris Sparks The Braves
By
A 50-21 record when he’s in the lineup might be the most impressive stat
-
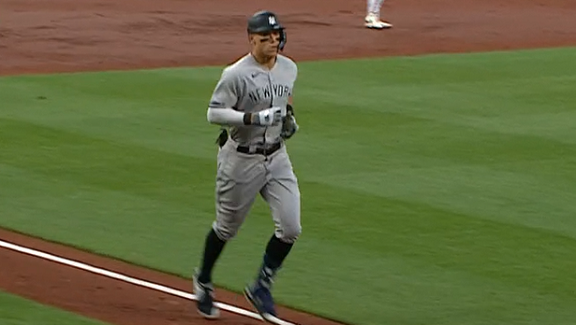
Stat Of The Week: Aaron Judge’s Amazing Stretch … And Season
By
He’s the ‘sockiest socker’ of them all in 2022.
-
Stat of the Week: Notable Outfielders Dealt At Deadline
By
How will Juan Soto and other deadline pickups impact their team defensively?
-
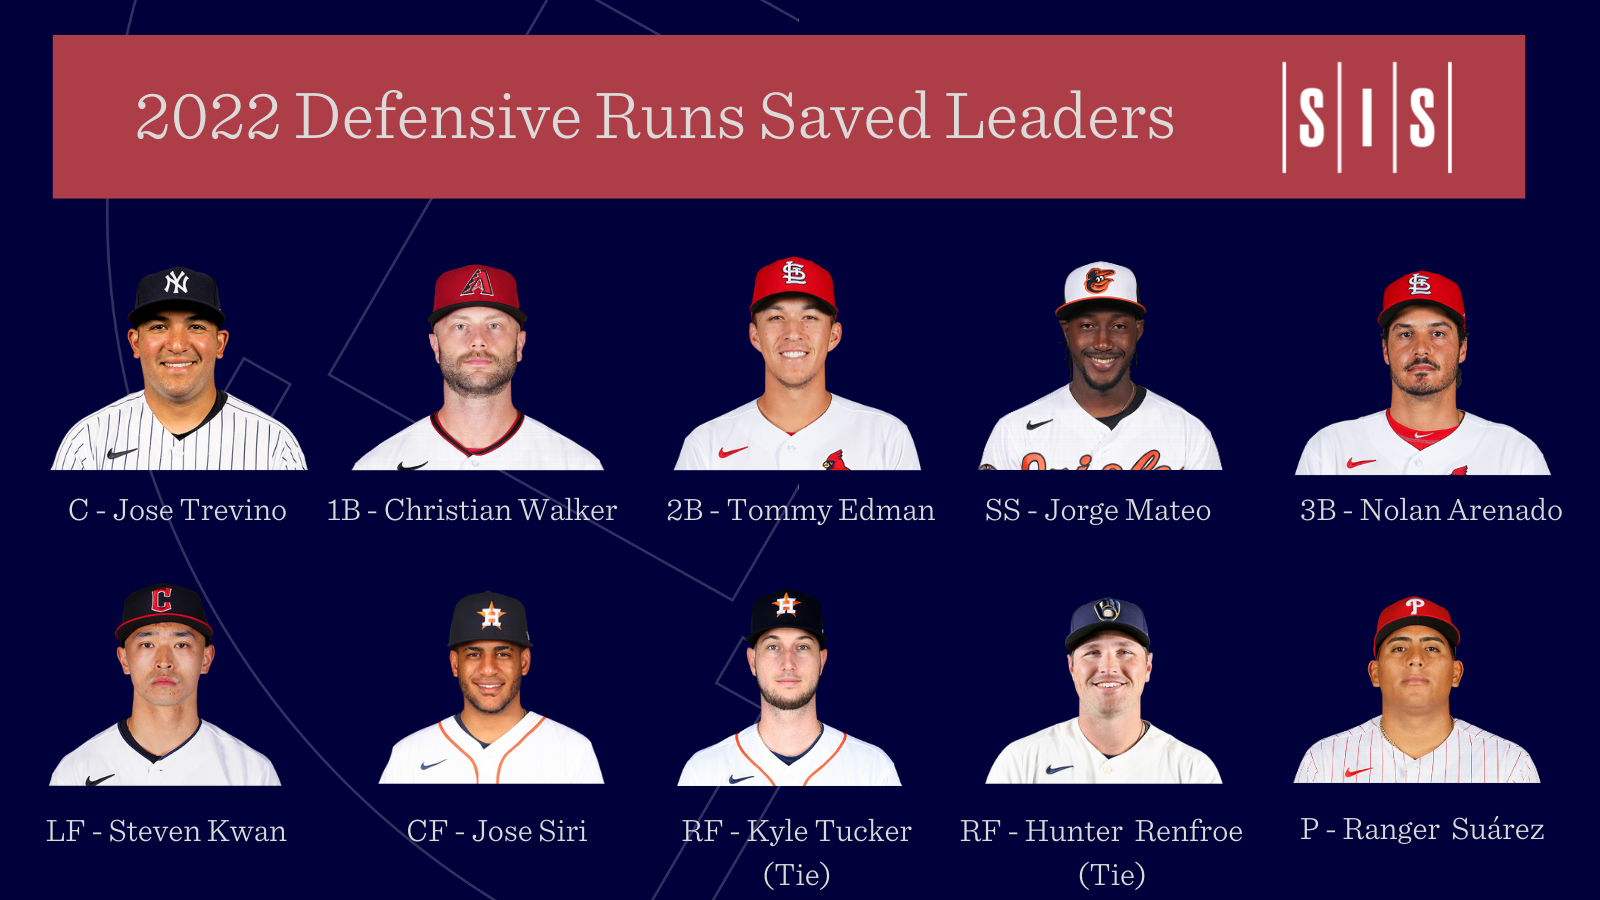
Stat of the Week: Who are MLB’s top pitch framers?
By
A number of players rate among the best, with Jose Trevino, Austin Barnes, and Cal Raleigh among those leading the way
-
-
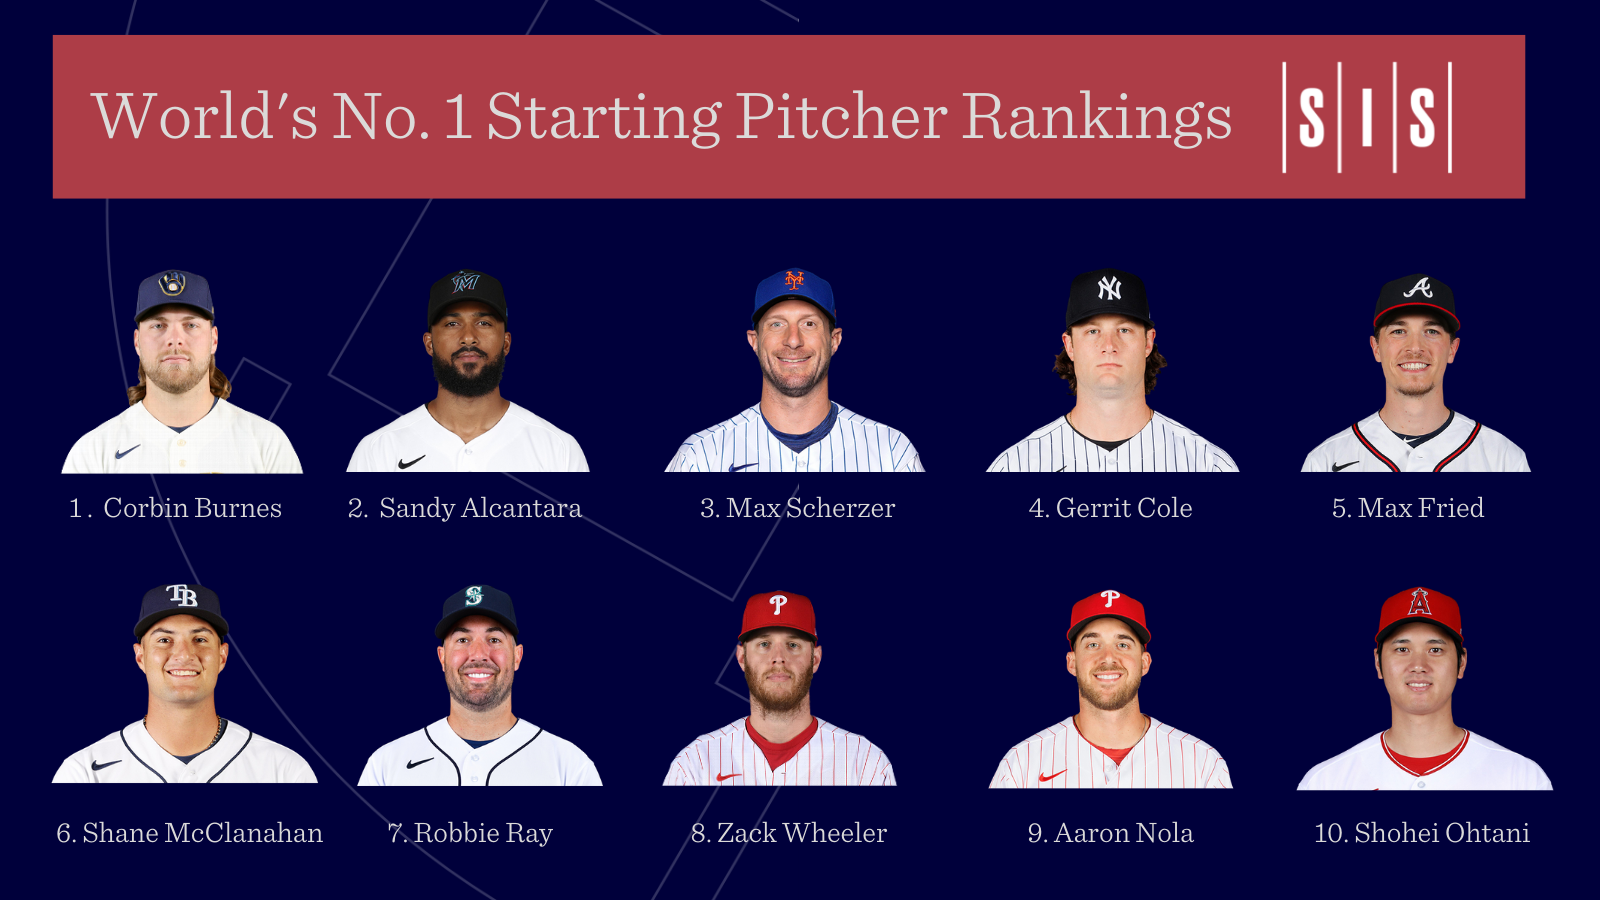
Stat of the Week: World’s No. 1 Starting Pitcher Rankings
By
Two pitchers are on nearly equal footing heading into the All-Star Break.
-
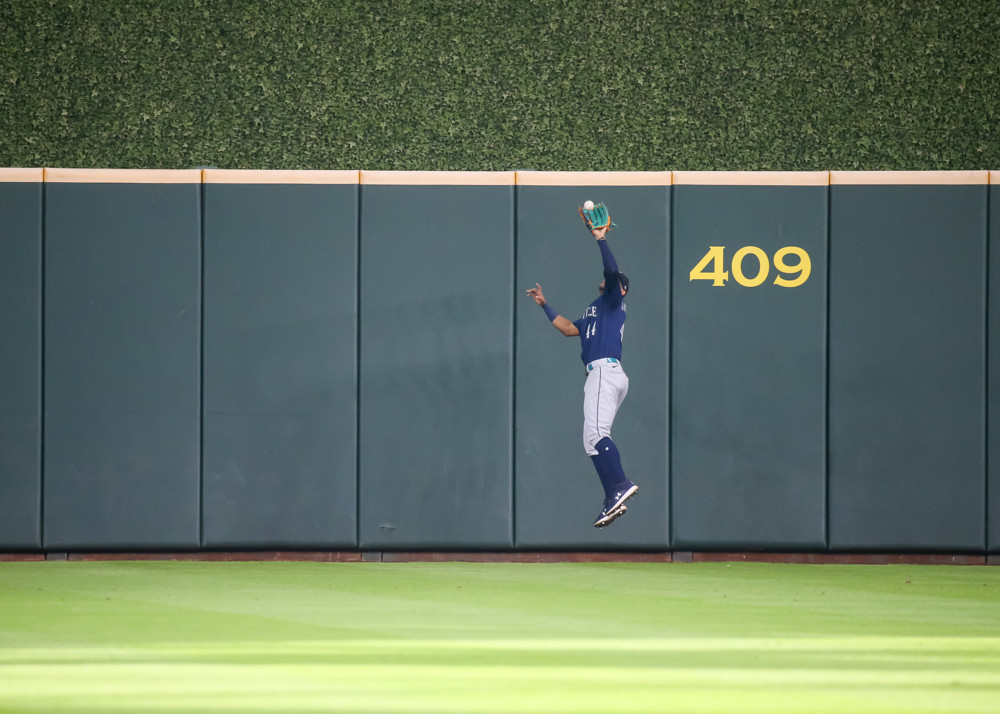
Stat of the Week: Don’t forget Julio Rodríguez’s Defense
By
Rodriguez is saving runs with his catches of deep fly balls.
-
-
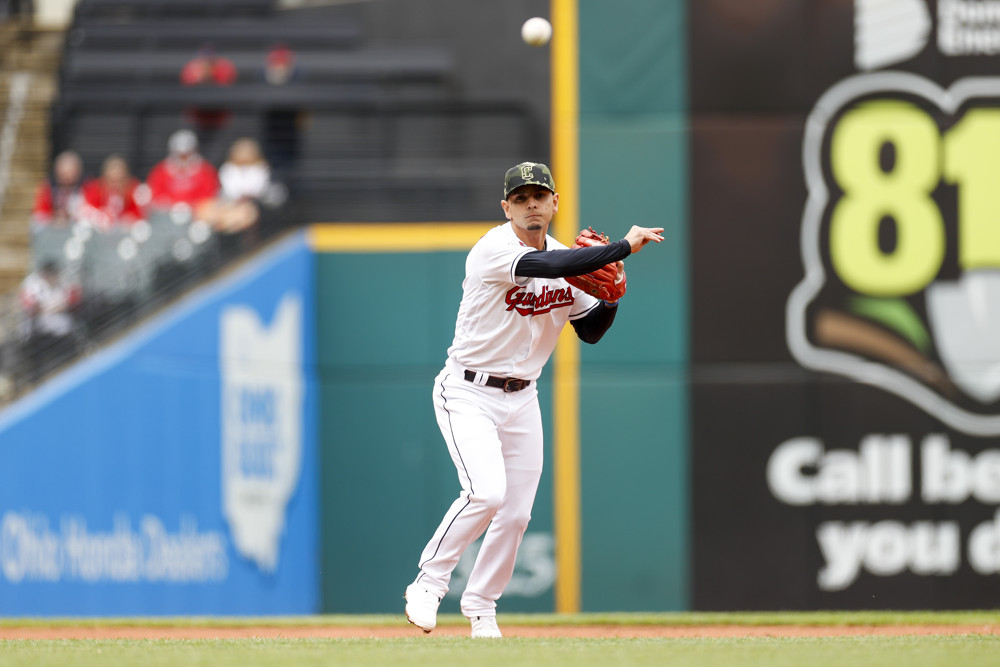
Stat of the Week: Braves Very Much In The Swing Of Things
By
Their success is a tribute to aggressiveness.