Sports Info Solutions
Category: Football
-
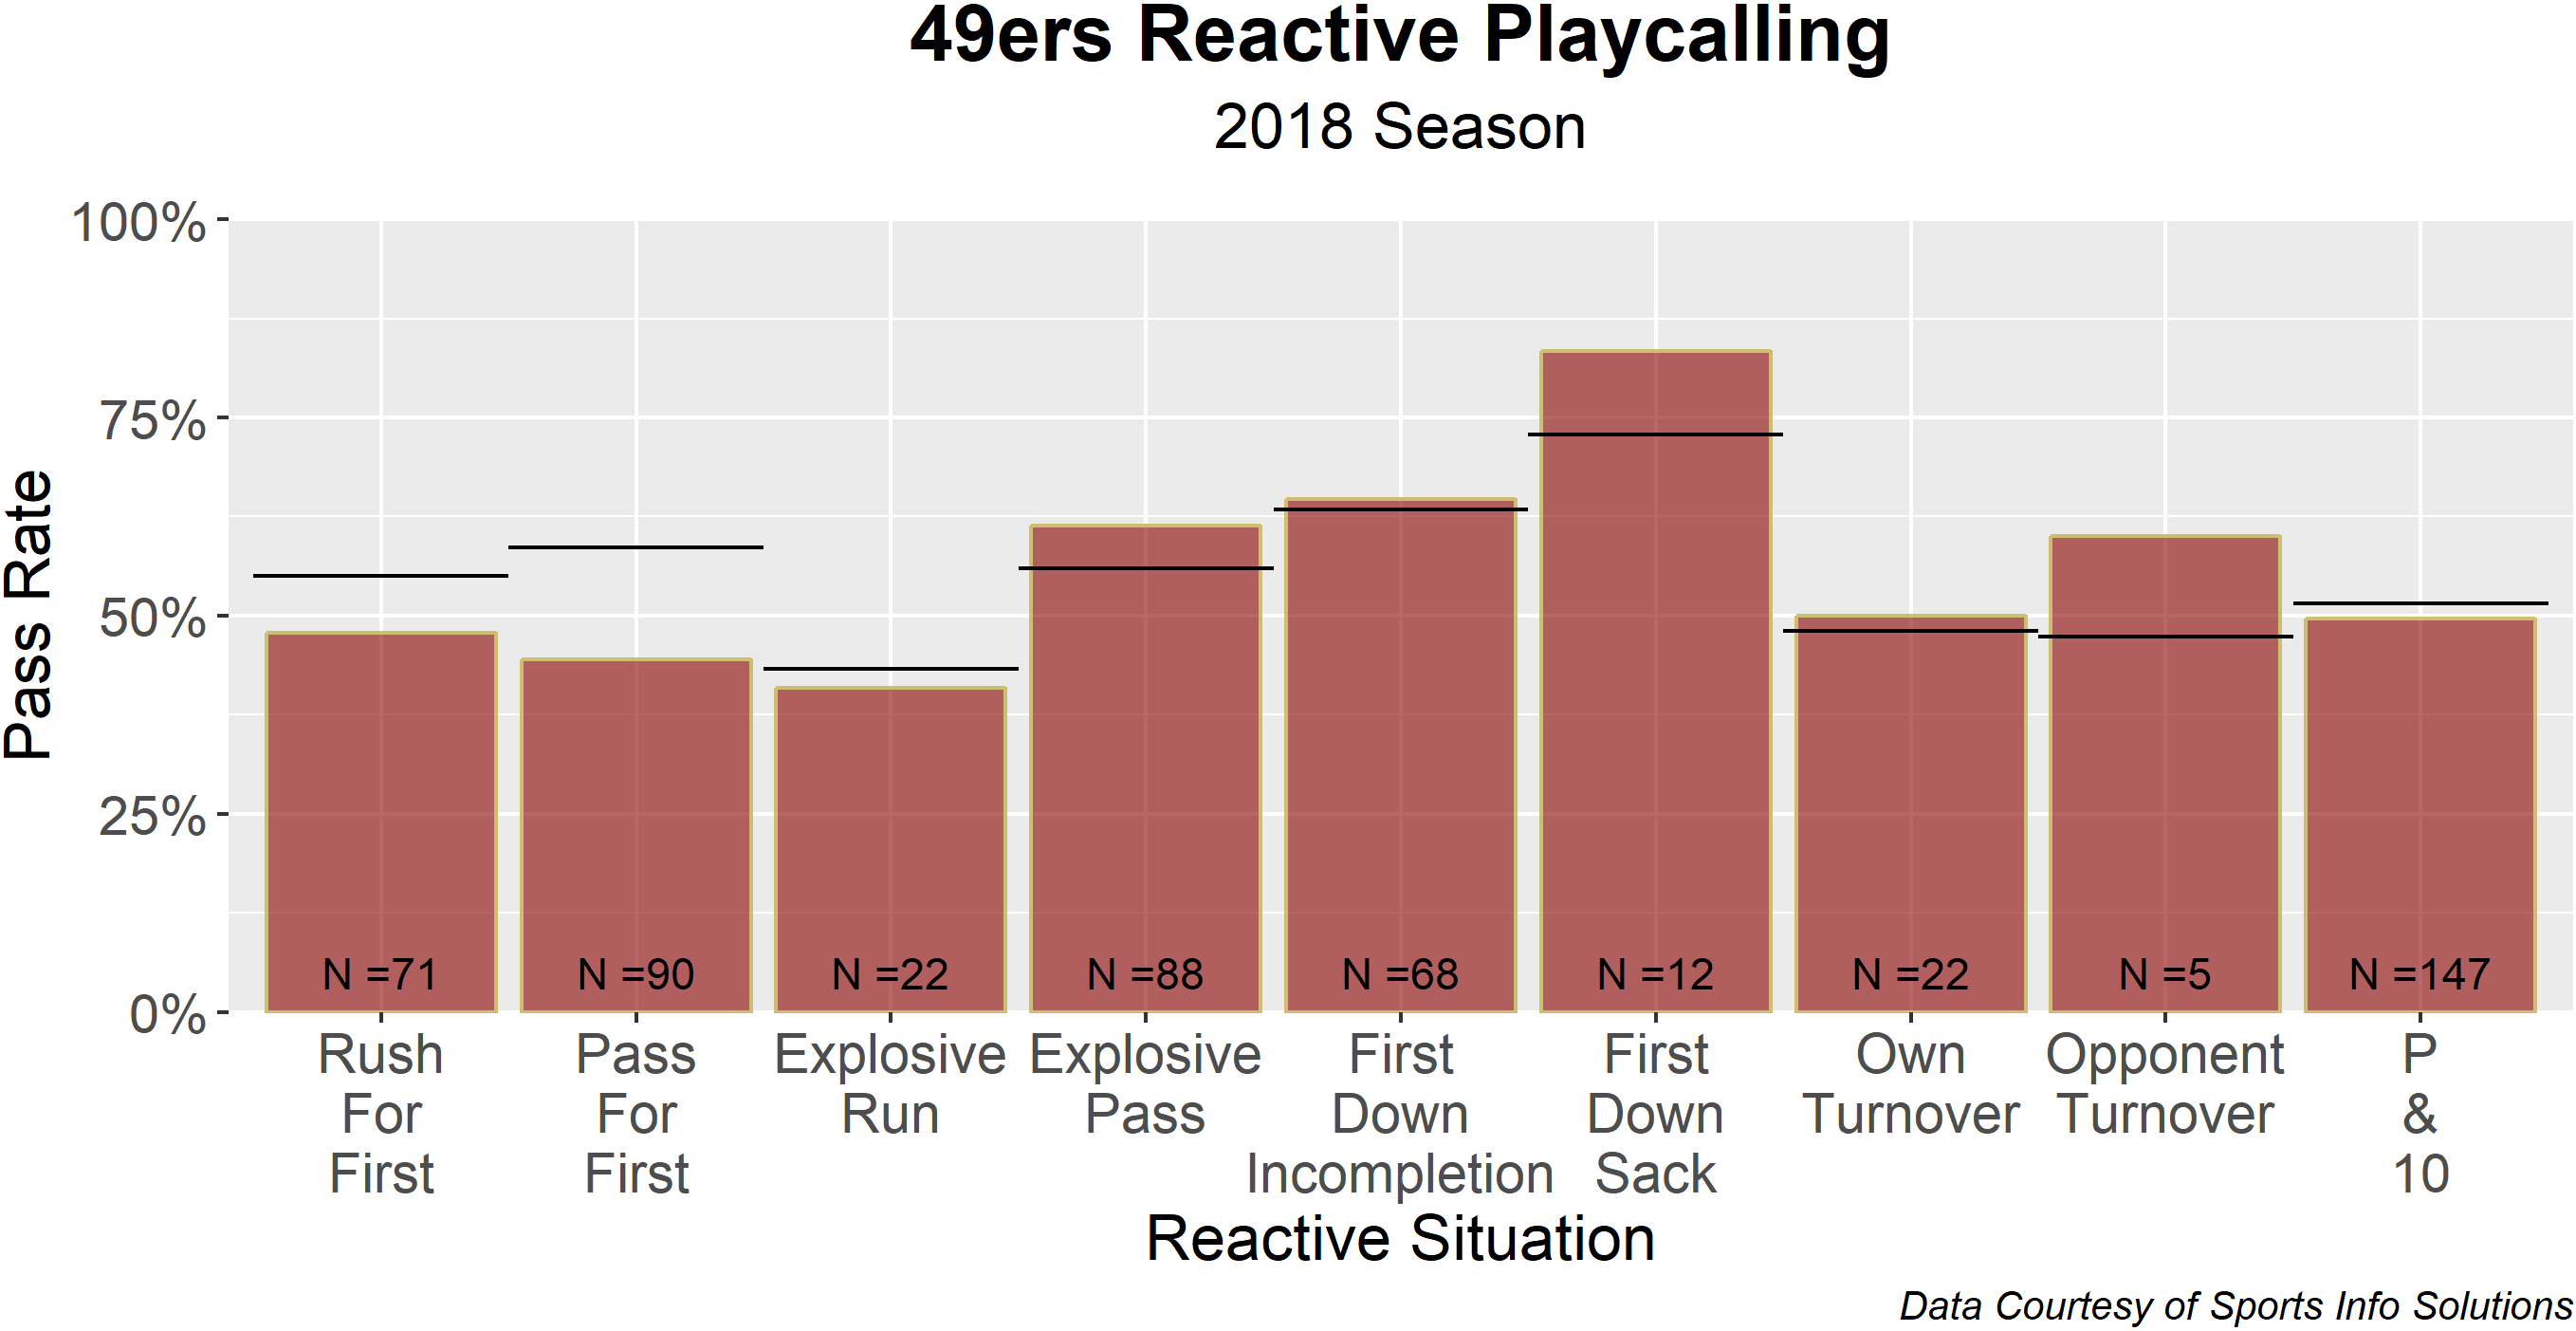
Reactive Playcalling in the NFL
By
How do playcallers behave differently following the particular outcome of a play? Every team is covered.
-
New football podcast episode: Fantasy Workloads and Expected Completions
By
A look at workload projections and a new stat called “Predictive Completions.”
-
-
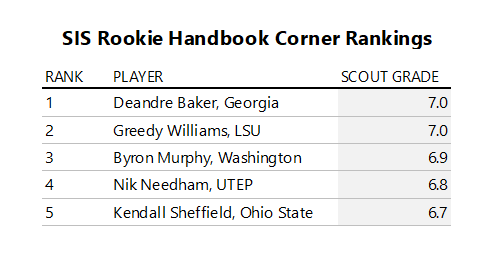
Using the Football Rookie Handbook to rate the Draft
By
The Titans and Ravens fared well. Others did not. Here’s a comprehensive look.
-
Sports Info Solutions NFL Round One Mock Draft
By
Members of the SIS operations department take their shot at figuring out the first round.
-
SIS Draft Special
By
Sports Info Solutions is opening its wealth of data to you for free during the NFL draft! To celebrate the draft, all trials to the SIS DataHub will have the trial status removed and be given full access to the most in-depth and accurate football database. The SIS DataHub is a premier research tool that…
-
NFL Draft: Best of the Rest
By
There are a few players who fell just outside the range of evaluation in our Football Rookie Handbook, but who bring something positive to the table.
-
A closer look at Iowa’s star tight ends
By
TJ Hockenson is more well-rounded, but both are top caliber.
-
Two Highly Rated Prospects Have Seen Their Draft Stock Take a Hit: Here’s Why
By
Greedy Williams and N’Keal Harry have seen their stock take a hit leading up to the draft. We try and figure out why:
-
An analytical look: Who are the best QBs after Kyler Murray?
By
Where do Dwayne Haskins, Drew Lock and Daniel Jones fall?