Sports Info Solutions
Category: Baseball
-

New baseball podcast episode: Mike Ferrin wants to be Byron Buxton
By
In this episode of the SIS Baseball Podcast (click here to listen), Mark Simon (@MarkASimonSays) begins by marveling at Zack Greinke’s defense (1:05). Mark then talks to MLB Radio and Arizona Diamondbacks broadcaster Mike Ferrin (@Mike_Ferrin). Mike makes his case for the best team in baseball (3:25) and discusses how much organizations value defense in…
-
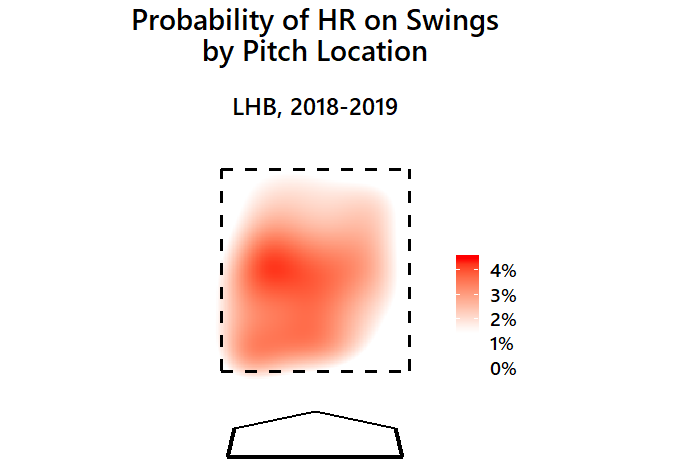
Visualizing Home Runs by Pitch Location
By
A look at which pitch locations generate home runs, and how it compares to several years ago when the home run wasn’t as common.
-
Ball off the Wall: Which outfielders make mistakes, which have not?
By
Who has the most misplays on playing balls off the wall? Who has made few or none?
-
Reintroducing FieldingBible.com
By
We’ve added lots of statistics to the FieldingBible.com website. Come check it out.
-
-
Inside the numbers on Urshela’s improvements
By
Urshela has had the magic touch when it comes to hitting the ball hard.
-
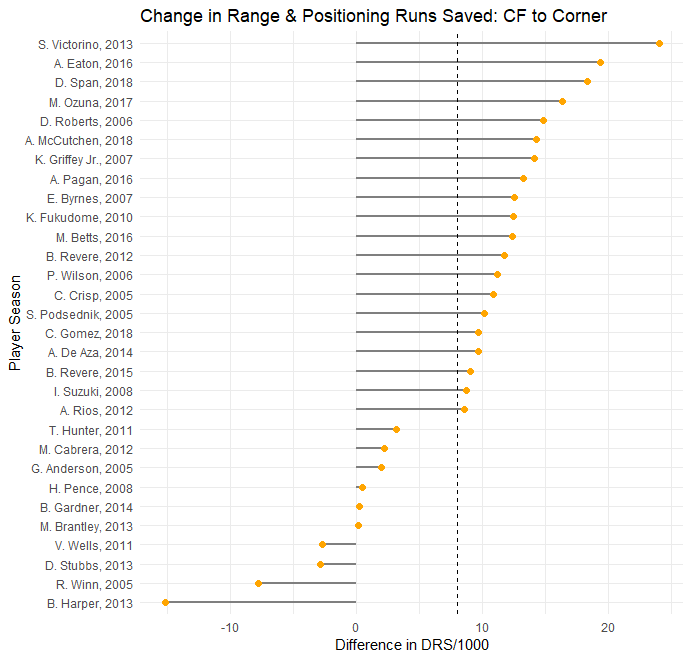
The Effect of Outfield Position Changes on DRS
By
How does DRS rate center fielders when they move to a corner? How do corner outfielders rate when they move to center?
-
Who’s Hit More Homers Than Expected? Fewer?
By
Which hitters may have been lucky or unlucky. Which benefited from their ballpark?
-
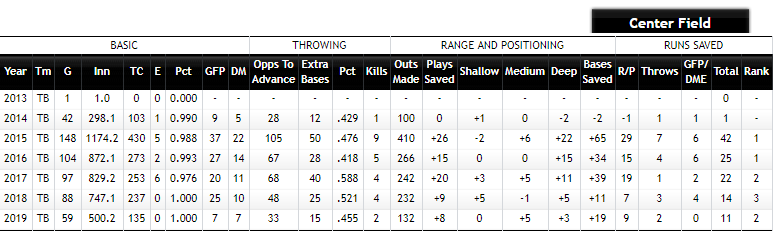
Stat of the Week: Kevin Kiermaier’s amazing Defensive Runs Saved total
By
Kiermaier recently moved into the top 10 for Defensive Runs Saved since the stat was first compiled in 2003.
-
New podcast episode: What does Moneyball look like in 2019?
By
This episode features guests who cover the Athletics, Rays and Twins discussing how those teams find edges nowadays.