Sports Info Solutions
Category: MLB
-
-
Inside the numbers on Urshela’s improvements
By
Urshela has had the magic touch when it comes to hitting the ball hard.
-
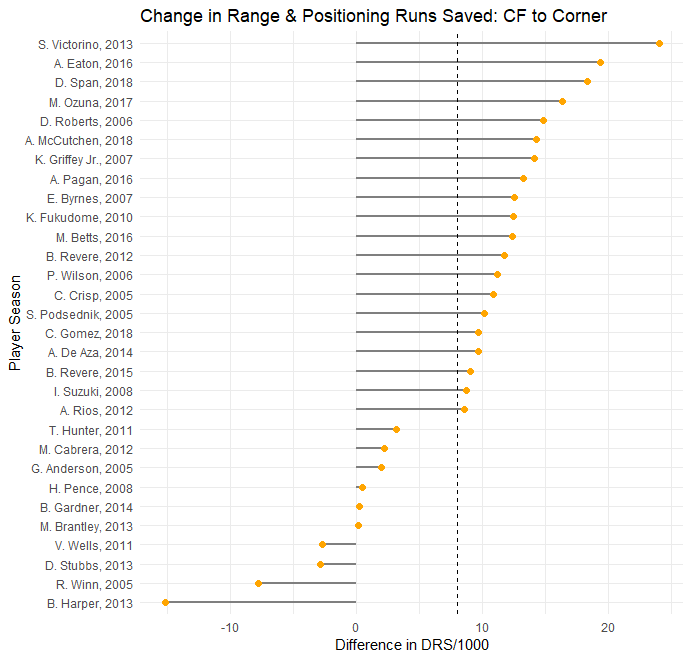
The Effect of Outfield Position Changes on DRS
By
How does DRS rate center fielders when they move to a corner? How do corner outfielders rate when they move to center?
-
Who’s Hit More Homers Than Expected? Fewer?
By
Which hitters may have been lucky or unlucky. Which benefited from their ballpark?
-
Stat of the Week: Kevin Kiermaier’s amazing Defensive Runs Saved total
By
Kiermaier recently moved into the top 10 for Defensive Runs Saved since the stat was first compiled in 2003.
-
New podcast episode: What does Moneyball look like in 2019?
By
This episode features guests who cover the Athletics, Rays and Twins discussing how those teams find edges nowadays.
-
Zack Greinke slider not what it once was
By
Some notes on the drop in performance of what used to be a key pitch.
-
MLB’s Best Positioned Infields
By
Teams like the Astros, Rays, and Dodgers are aggressive in their positioning of infield defenders. Which teams have been best positioned in 2019?
-
How does J.T. Realmuto have 10 Defensive Runs Saved?
By
Suddenly J.T. Realmuto is one of the top-rated defensive catchers in MLB.
-
Which Pitchers Are Forced to Throw the Most Extra Pitches?
By
Whose defenses have let them down? We’ve got a list of the top 10.