Sports Info Solutions
Category: NFL
-
Introducing the Total Points System to College Football
By
A way to evaluate FBS players that breaks down every aspect of on-field performance.
-
Two NFL prop possibilities supported by data
By
A closer look at Jordan Love and Justin Jefferson’s draft position.
-
Evaluating offensive line needs for teams that use certain run schemes the most
By
By LOGAN KING Sports Info Solutions (SIS) brings you the second annual edition of The SIS Football Rookie Handbook, with scouting reports and statistical breakdowns on over 280 college football players who are likely to be drafted or signed as rookie free agents in 2020 (a glossary for the below stats can be found here).…
-
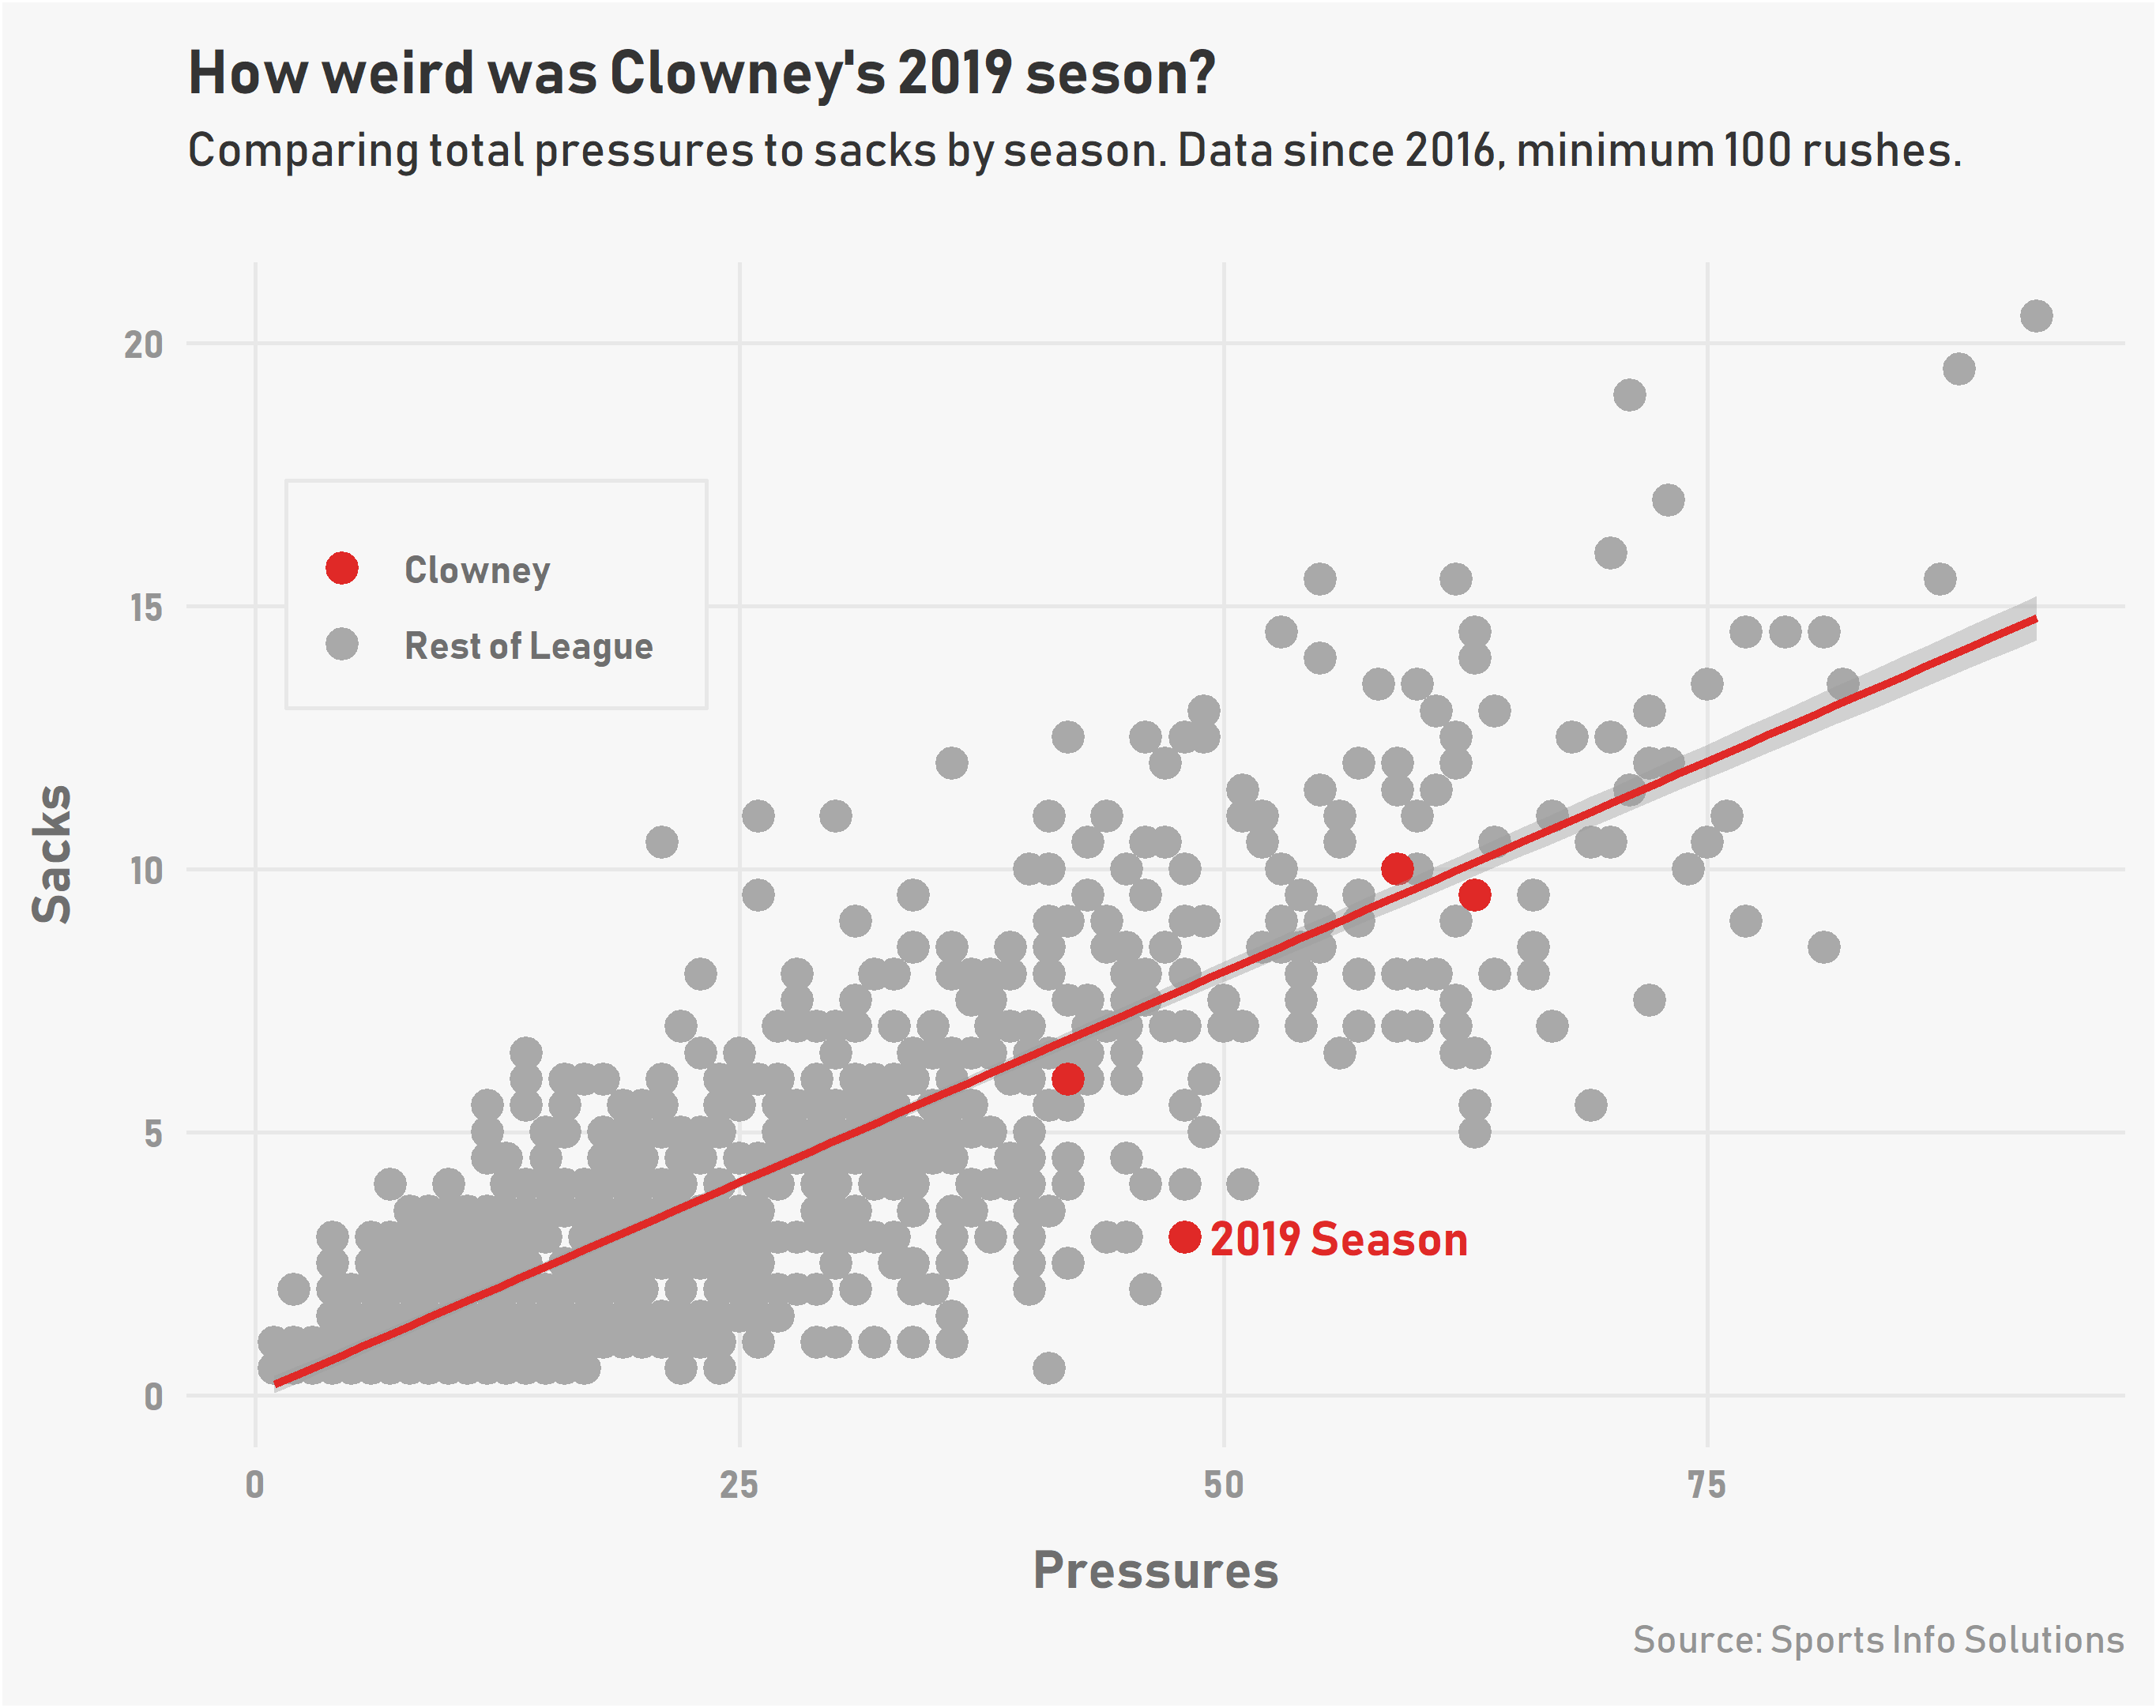
Jadeveon Clowney is better than he showed in 2019
By
A closer look at the numbers shows why Clowney could still be a very good get for someone.
-
Evaluating The Downfield Aggression Of Quarterbacks
By
Which QBs in the NFL and FBS were the most and least aggressive in 2019?
-
Which positions are deepest in the 2020 NFL Draft
By
We look at how deep each spot is and which team needs a player at that position the most.
-
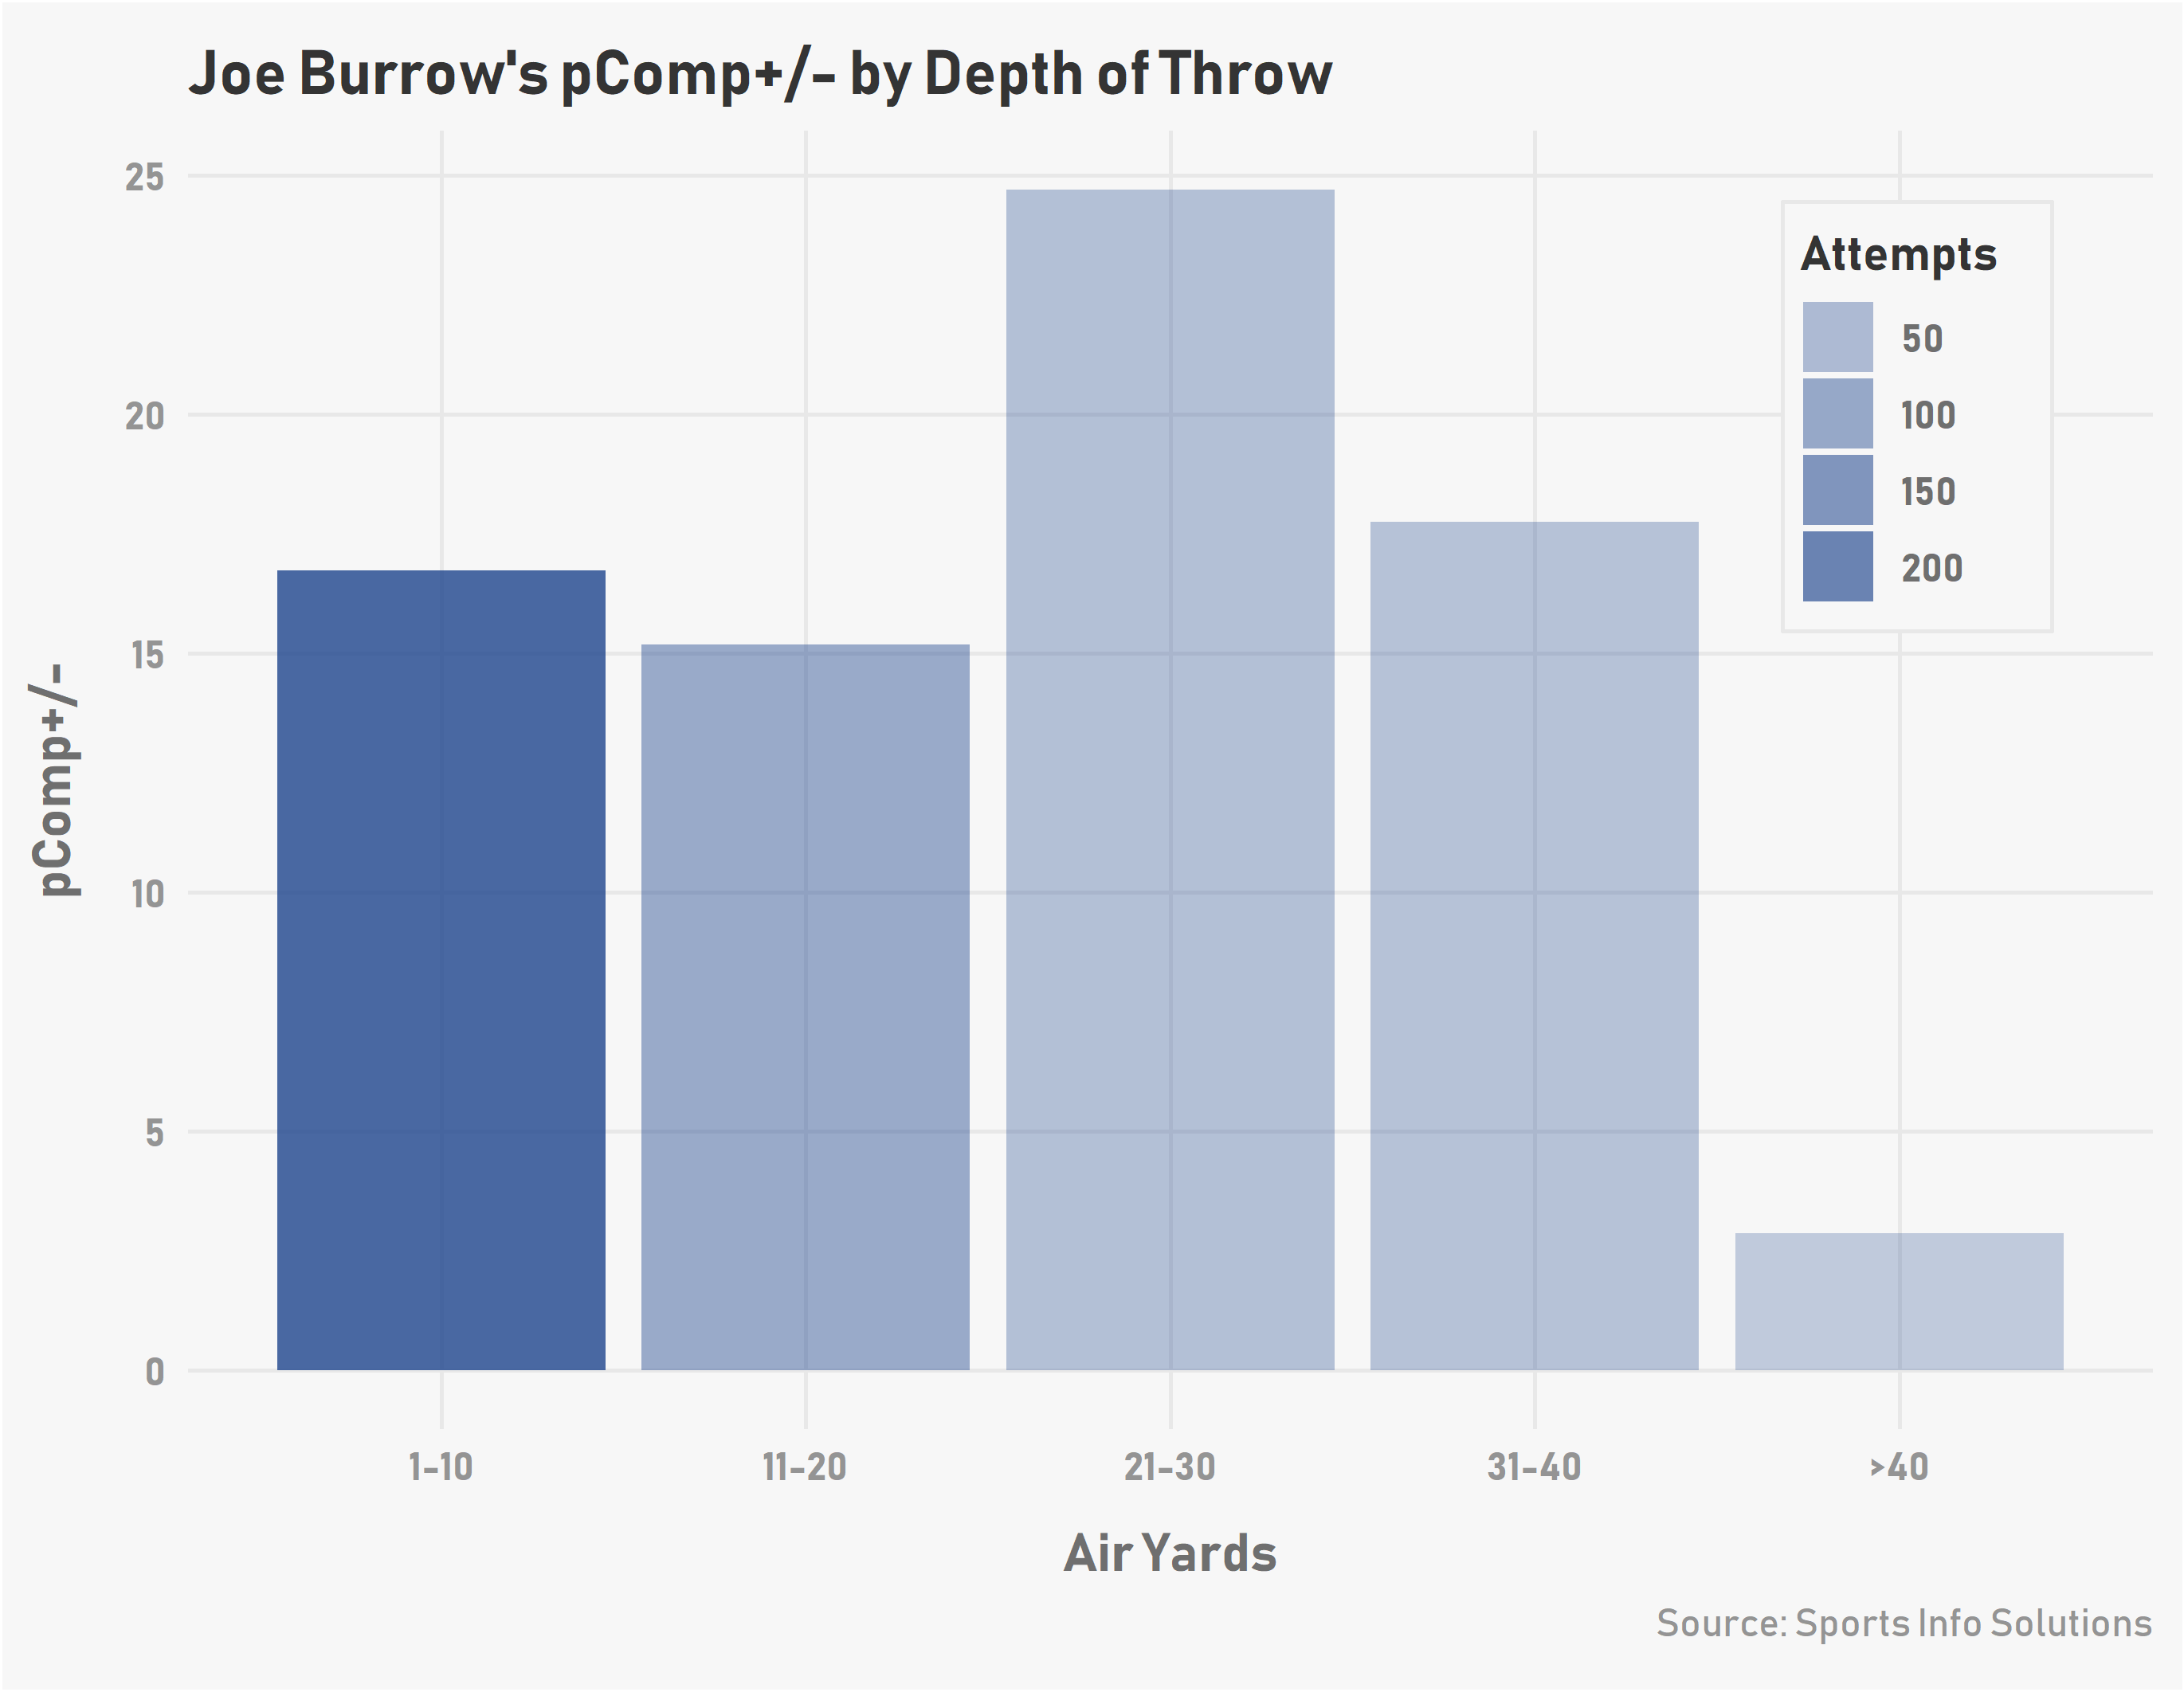
Evaluating Draft Prospects Using Predicted Completion Percentage
By
Taking a look at some top prospects in this year’s draft using two new metrics from SIS.
-
Statistically speaking, who’s better for the Bears: Nick Foles or Mitch Trubisky?
By
The acquisition of Foles gives the Bears a credible option to consider.
-
Which QBs received the most/least help from receivers on completions?
By
By John Shirley Here at Sports Info Solutions our video scouts chart many things within each NFL game, including multiple in-depth data points pertaining to quarterback accuracy. Our in-depth quarterback accuracy is charted on three scales: Whether the pass was Completed Whether the pass was Catchable Whether the pass was On-Target (Includes throws that are…
-
Who were the top red zone receivers among NFL prospects?
By
Which receiving prospects can handle the pressure of catching and scoring from in close?