Sports Info Solutions
Tag: Bill James
-
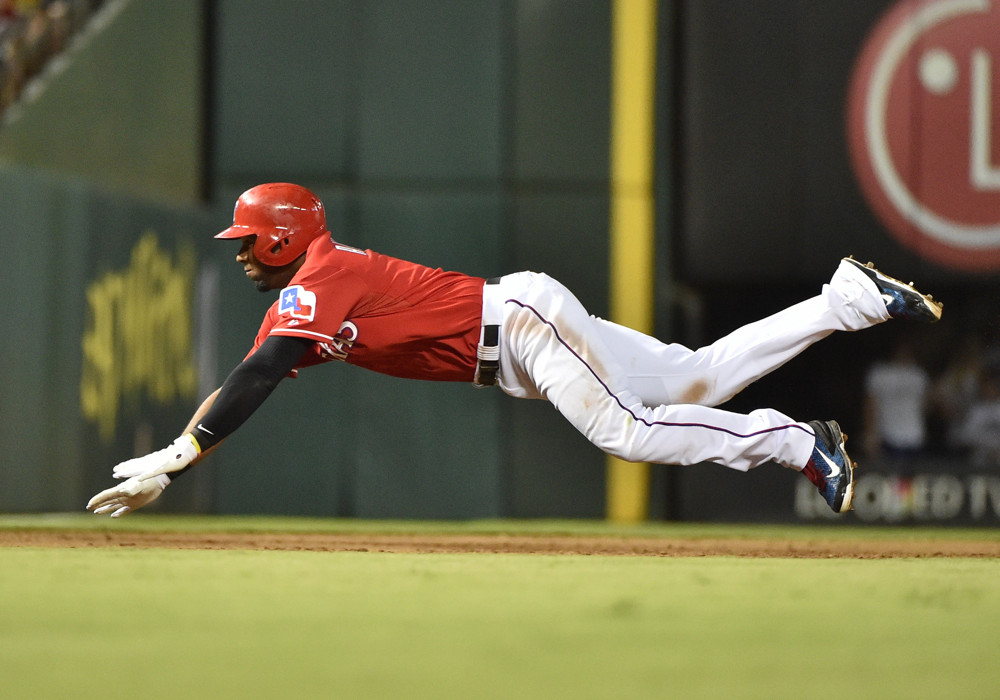
Bill James Handbook Excerpt: Baserunning In Its Own Self
By
The differences in evaluating baserunning comparing now vs when the Handbook was first published in 1989.
-
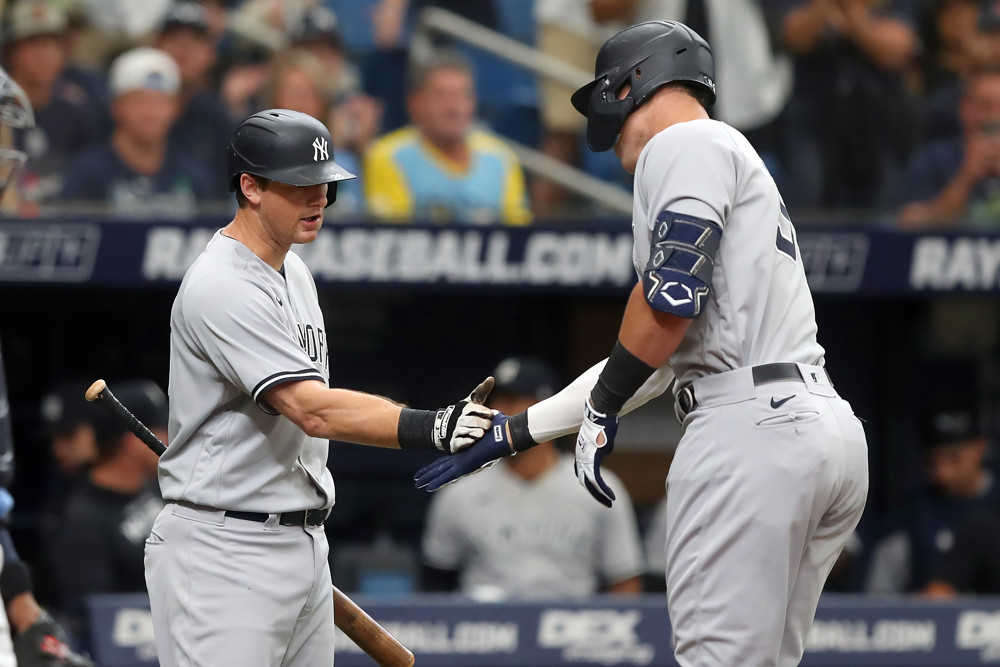
Bill James Handbook 2023 Excerpt: A Sizable Portion
By
We want you to buy the book! Here are nine snippets from essays by Bill James and our R&D staff.
-

Bill James Handbook Excerpt: World’s No. 1 Starting Pitcher
By
Sandy Alcantara ended the season on top … but it was close.
-
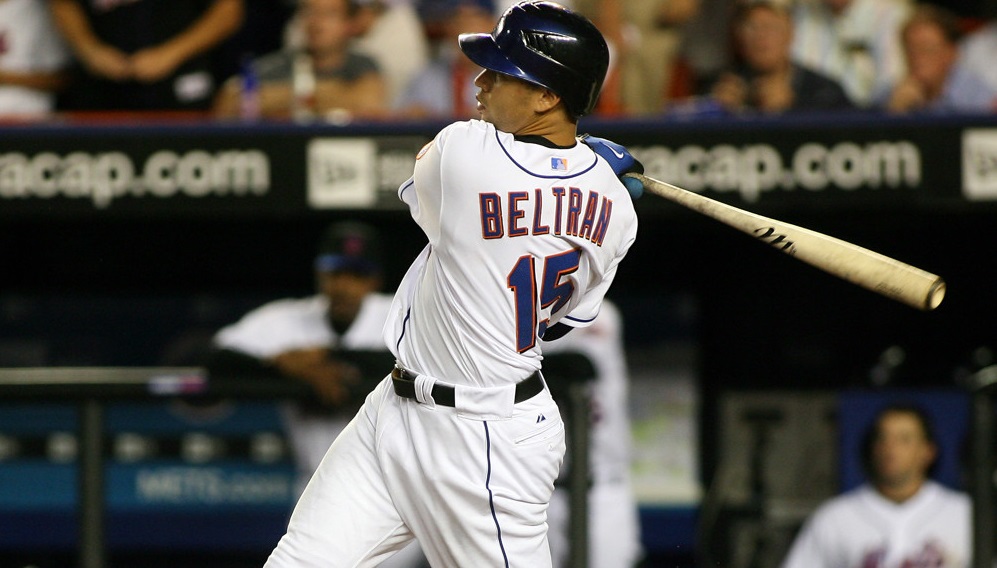
Stat of the Week: Upcoming Hall of Fame Classes
By
There are 3 first-time candidates coming up in the next 2 years who have Hall-worthy numbers.
-
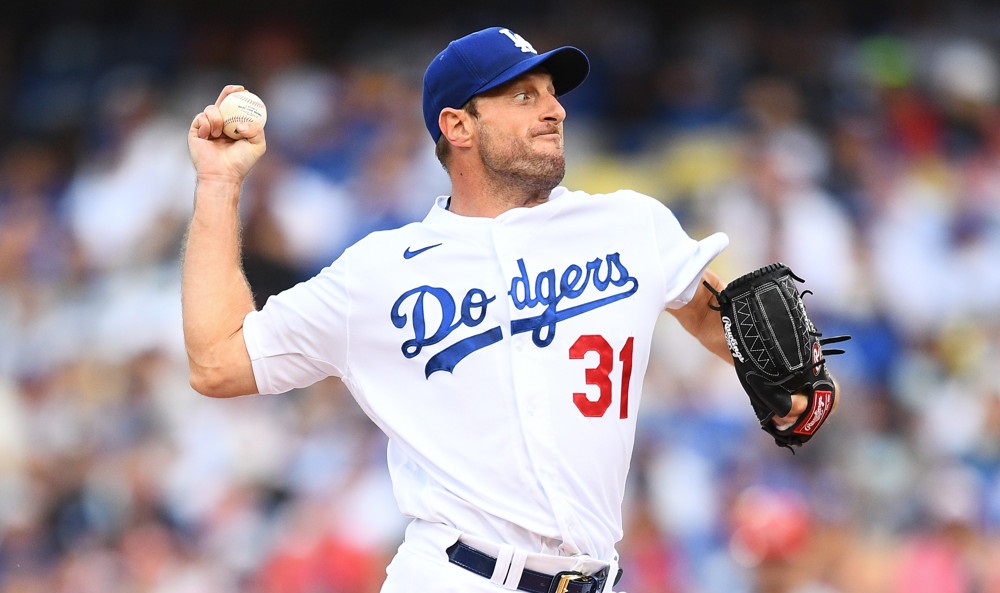
Which Players Have High Injury Risk in 2022? (Bill James Handbook Excerpt)
By
This Bill James Handbook excerpt lists and explains those players in our top 10 for 2022, and yes – Max Scherzer is on the list.
-
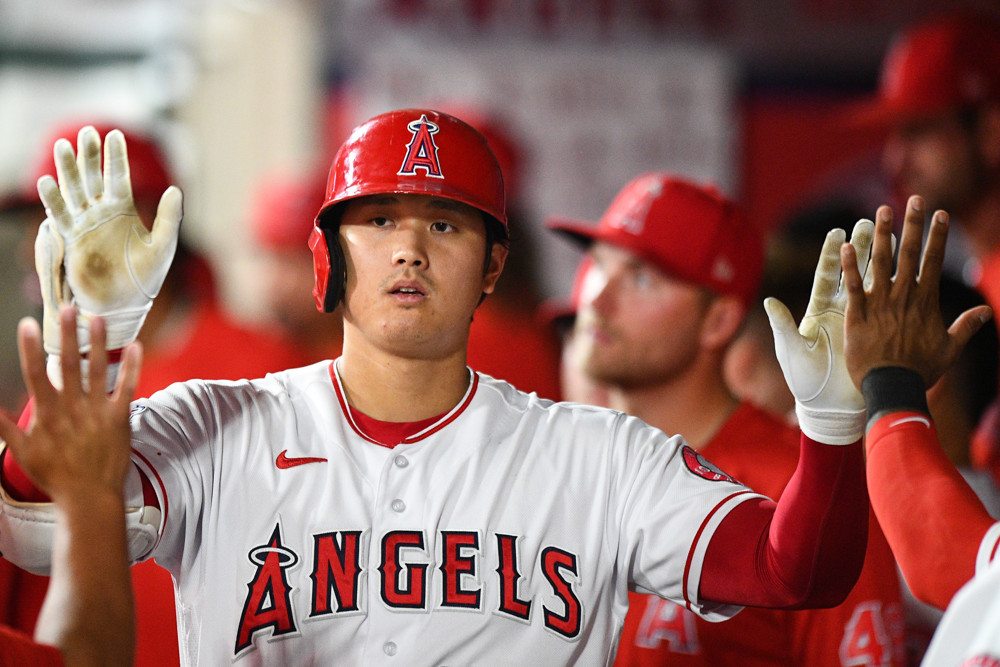
Bill James Handbook Excerpt: Shohei Ohtani
By
In this excerpt we look at how the first series of the season set the tone for Shohei Ohtani’s amazing 2021
-
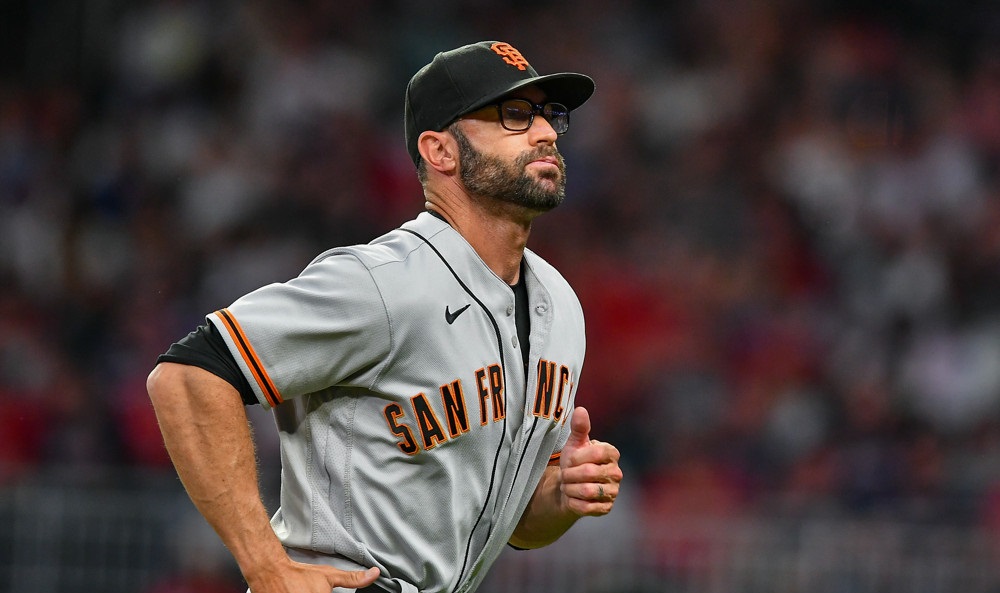
Bill James Handbook Excerpt: The Manager and the Jeopardy Champ
By
Gabe Kapler and Matt Amodio had some commonalities in how they managed their respective games.
-
Bill James Handbook Excerpt: The Favorite Toy
By
A 40-year-old Bill James’-devised tool is still a good way to look at a player’s chance of reaching a milestone.
-
Bill James Handbook Excerpt: 2021’s Most Efficient Team
By
Some may call it luck – we call it efficiency.
-
The 2021 Fielding Bible Award Winners
By
Who did our panel of experts pick as the top defensive players of the season?