Sports Info Solutions
Category: MLB
-
With Byron Buxton out again, let’s find his most statistically similar player
By
BY ALEX VIGDERMAN While on a rehab assignment for another injury this past weekend, Byron Buxton fouled a ball off his toe and suffered a hairline fracture, sidelining him again in what is quickly shaping up to be a lost season. We all love keeping track of the trials and tribulations of Buxton as a…
-

Why does Bryce Harper have -5 Defensive Runs Saved?
By
By MARK SIMON Just like with offensive statistics, defensive statistics take time for samples to build up. But there was one number from the early-season metrics that I wanted to at least look at a little more closely – Bryce Harper’s -5 Defensive Runs Saved. Harper had saved 28 runs defensively in his first six…
-

Who are the best outfielders at avoiding mistakes?
By
Continuing our look at the most mistake-free players in baseball, we focus on the likes of Alex Gordon and A.J. Pollock.
-
Limiting damage, improved walk rate keying Phillies’ success
By
By ALEX VIGDERMAN At least through the first third of the year, 2018 is shaping up to be the Year of Philadelphia. The Eagles finally won the Super Bowl, the Villanova Wildcats (admittedly merely a Philly suburb) won their second National Championship in three years, and the 76ers seem to finally be rewarding their fans’…
-
Who are the best infielders at avoiding mistakes?
By
By MARK SIMON A couple of weeks ago, we ran an article in The Athletic explaining our detailed scoring system for tracking Defensive Misplays and Errors. The piece focused mostly on those who were frequent mistake-makers, so we thought that we would share a look at the game’s best at avoiding defensive mistakes. We’ll do…
-
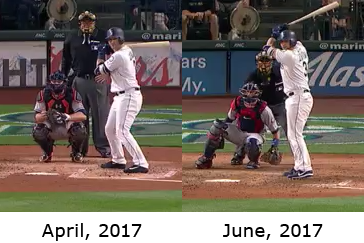
Breaking Down Mike Zunino’s Swing Changes
By
If you haven’t noticed, Mike Zunino has been smashing baseballs lately. Since his call-up from Triple-A (May 22) where he underwent mechanical changes, he’s hit .311/.364/.667 with nine home runs and five doubles. He’s driving the ball to center field and making an honest effort to use all parts of the field. And the mechanical…
-
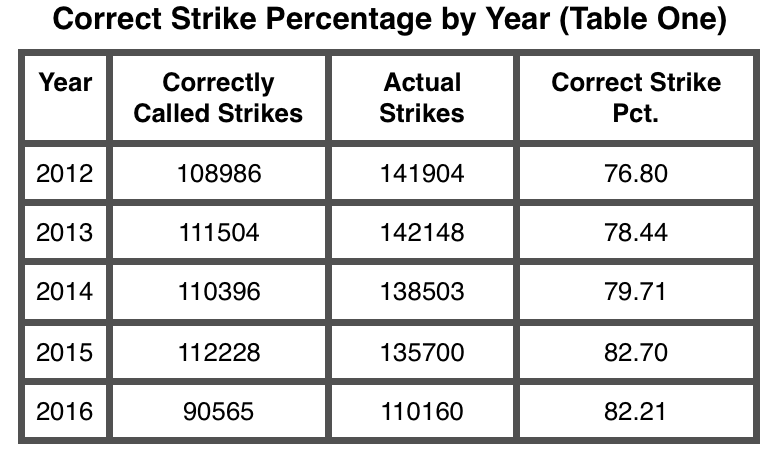
The Strike Zone and the Umpires That Control It
By
Introduction One of the most discussed issues in Major League Baseball is the consistency of the strike zone. The Rule Book strike zone states “The STRIKE ZONE is that area over home plate the upper limit of which is a horizontal line at the midpoint between the top of the shoulders and the top of…
-
My Fielding Bible Awards Ballot
By
Filling out my Fielding Bible awards ballot for the first time was exciting and difficult. Fielding is tough to measure, but Baseball Info Solutions helps provide data to help with that issue. As video scouts, we get to watch baseball for hours every day, giving us a pretty good idea how good defenders in MLB…
-
Defensive Philosophies
By
In this era of baseball, there are now two philosophies on how to play defense. Each philosophy is trying to demonstrate which way is best to convert balls into outs. The traditional way of playing a straight up defense has been slowly dying out while the idea of moving defenders around is taking over the…
-
WHAT IS WRONG WITH JASON HEYWARD?
By
Jason Heyward’s offensive performance—or lack thereof—in 2016 has been very well documented. He is currently on pace to finish the year with career lows in just about every offensive category, including batting average, slugging percentage, and on-base percentage. To that point, his current wRC+ of 70 is by far the worst of his career, and well…