For the third straight year, Sports Info Solutions is rewarding defensive excellence on a global level. Today, we announce the winners of the NPB and KBO Fielding Bible Awards.
The awards were voted on by a panel of experts and members of SIS’ operations staff, who spent the entire season tracking NPB and KBO games. Among our voters were Jeeho Yoo (Yonhap News Agency, South Korea), John Gibson (Japanese Baseball Weekly Podcast), and Jason Coskrey (Japan Times).
Each voter ranked their top three players at each position in the league they covered, as well as a multi-position (utility) player, with 5 points awarded for a first-place vote, 3 for second and 1 for third. Eligibility for voting was based on playing-time requirements.
(note that in accordance with Japanese and Korean customs, we are listing the players with their family name first)
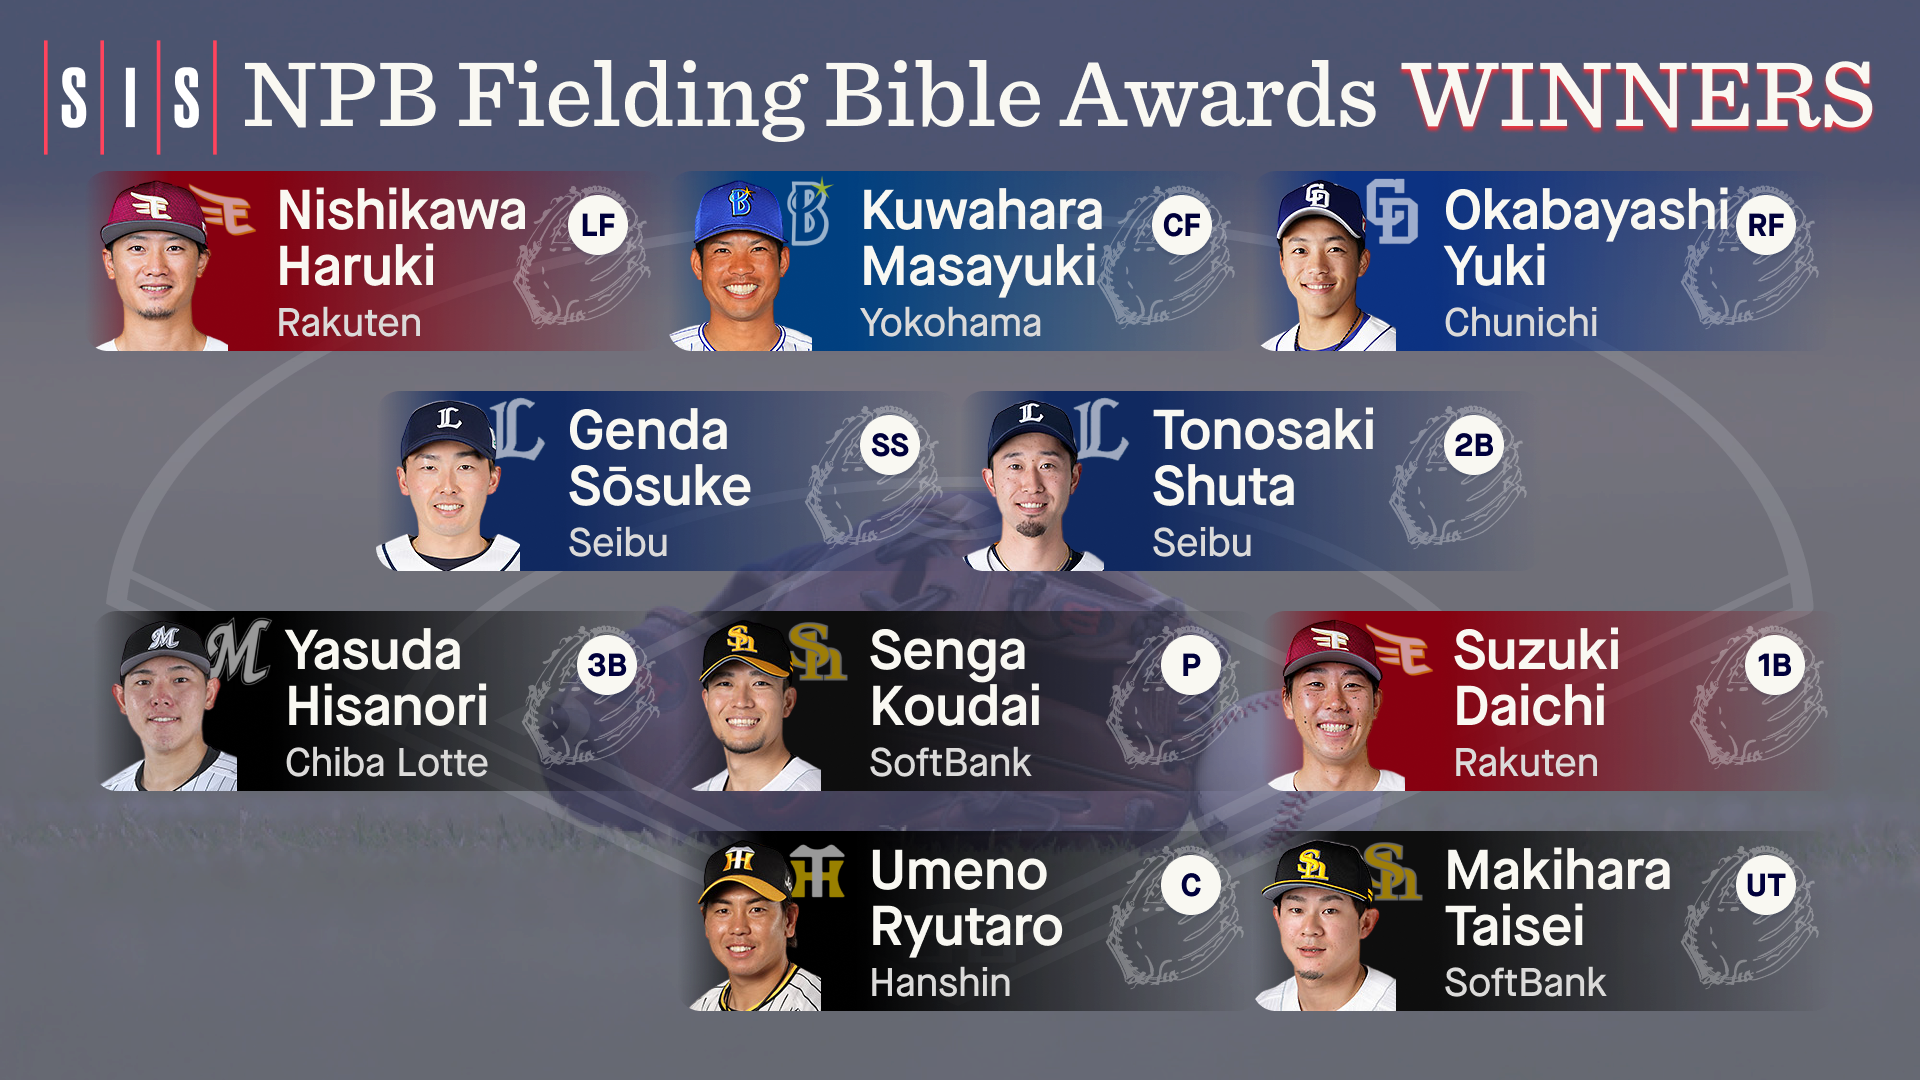
Seibu Lions shortstop Genda Sōsuke became the first NPB player to win a Fielding Bible Award at the same position twice in the award’s three-year history. Genda, who previously won the award in 2021, saved 20 runs with his defense this season, easily the most among NPB shortstops
Genda’s Seibu teammate, second baseman Tonosaki Shuta, also won the Fielding Bible Award at his position. Tonosaki led NPB second basemen with 26 Runs Saved. Genda and Tonosaki had more Runs Saved at their positions than any MLB player.
Two other pairs of teammates won, first baseman Suzuki Daichi and left fielder Nishikawa Haruki of the Rakuten Golden Eagles and pitcher Senga Koudai and multi-position player Makihara Taisei of the Fukuoka SoftBank Hawks. Senga is one of the top free agent pitchers and is available to MLB teams this offseason. Makihara goes by the nickname “King Joker” because of his utility role.
Nishikawa, Genda, Tonosaki, Okabayashi Yuki (right field), and Umeno Ryutaro (catcher) were the winners who recorded at least 10 Runs Saved at their respective positions. Umeno had arguably the most dominating season in the league, finishing with 23 Runs Saved. The next-closest catcher among eligible candidates had only 12.
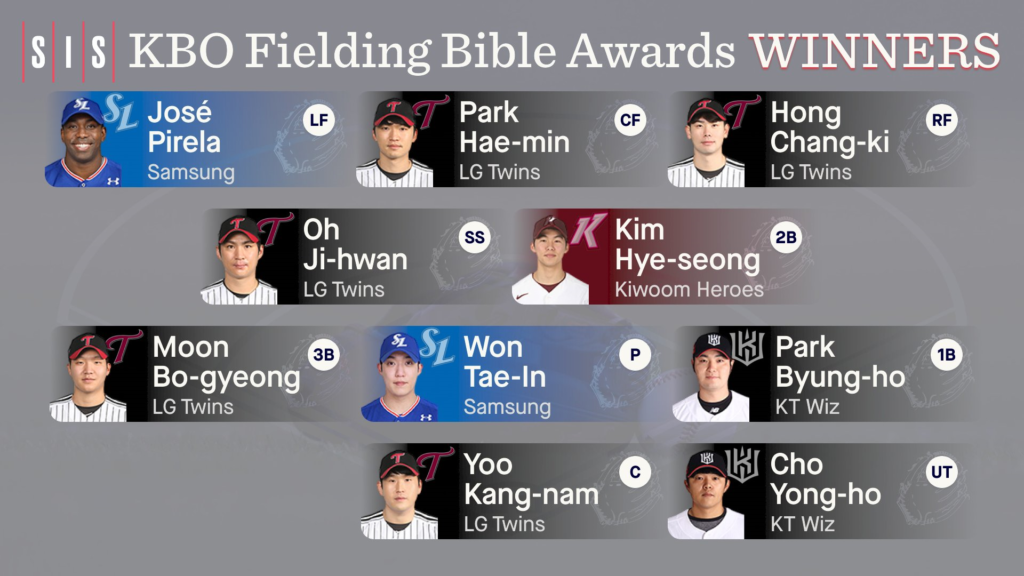
The LG Twins led KBO in Defensive Runs Saved in 2022 and their players earned the rewards of that. Five of them won a Fielding Bible Award at their respective position.
Catcher Yoo Kang-nam, shortstop Oh Ji-hwan, third baseman Moon Bo-gyeong, center fielder Park Hae-min, and right fielder Hong Chang-ki all were winners for LG. Oh, Kim, and Park each won at their positions for the second time, the only three players who have won twice at their positions in the three-year history of the award
Yoo, Moon, and Hong were the three winners to finish with at least 5 Runs Saved at their respective positions. Defensive Runs Saved are calculated using an MLB basis and KBO Runs Saved totals are generally considerably lower than their MLB counterparts.
Two former major leaguers won a Fielding Bible Award. First baseman Park Byung-ho, who played for the Twins in 2016, won in his first season with the KT Wiz, for whom he also hit 35 home runs. And left fielder José Pirela, who also had a great offensive season, was one of two winners on the Samsung Lions along with pitcher Won Tae-in. Pirela formerly played in the majors from 2014 to 2019 for the Yankees, Padres, and Phillies.