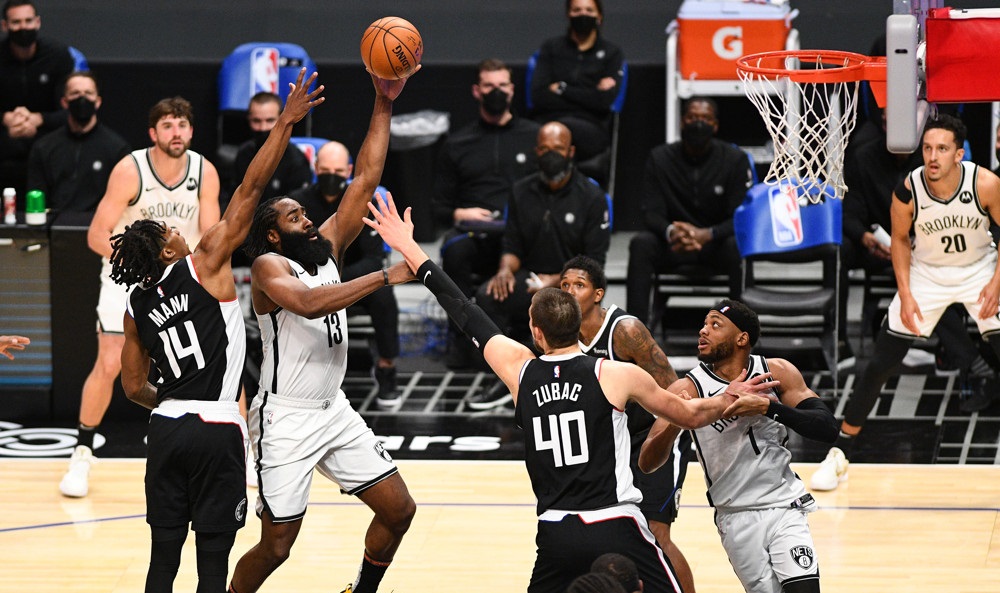
Photo: Melissa Tamez/Icon Sportswire
When Alperen Şengün was escorted off the court in a wheelchair it was a common assumption that the Rockets’ season had effectively ended. Up to that day on March 10th, Şengün had arguably been the team’s most impactful player.
Sitting at 29-35 on the season, the Rockets’ were 4.5 games behind the 10th place Warriors. Instead of having this be a disappointing end to an encouraging season, the Rockets won another 9 games in a row, pushing their streak to an impressive eleven games.
The Rockets’ streak was largely fueled by their offensive improvement that a new lineup brought forth.
Increased Spacing
The Rockets quickly shifted to a starting lineup that featured more spacing and less size. Second year forward Jabari Smith slid down to center, while rookie Amen Thompson was promoted to the starting 5.
As a result of this change, Houston has seen an increase in operating space on the court. By using player-tracking data, we can gauge how much space the team has on offense based on the location of their players, creating a convex hull.
Before Şengün went down with injury, Houston ranked 20th in convex hull, with the team being slightly more spaced during minutes where Şengün was on the bench. Since the injury, the Rockets have skyrocketed up to 6th in the league, creating significantly more space on offense.
As a product of this newfound spacing the Rockets have had the 2nd-best offensive efficiency in the league and are handling created advantages more competently.
| Pre Şengün Injury | Post Şengün Injury | |
| Offensive Efficiency | 113.5 (24th) | 121.8 (2nd) |
| Advantages Inherited* | 108.3 (22nd) | 113.5 (10th) |
| Advantages Maintained** | 39.5 (22nd) | 20.7 (11th) |
*Advantages Inherited: Player’s inherit at least a semi-advantageous situation in their on-ball chance.
**Advantage Maintained: Player inherits at least a semi-advantage and at minimum maintains their team’s advantage on their on-ball chance.
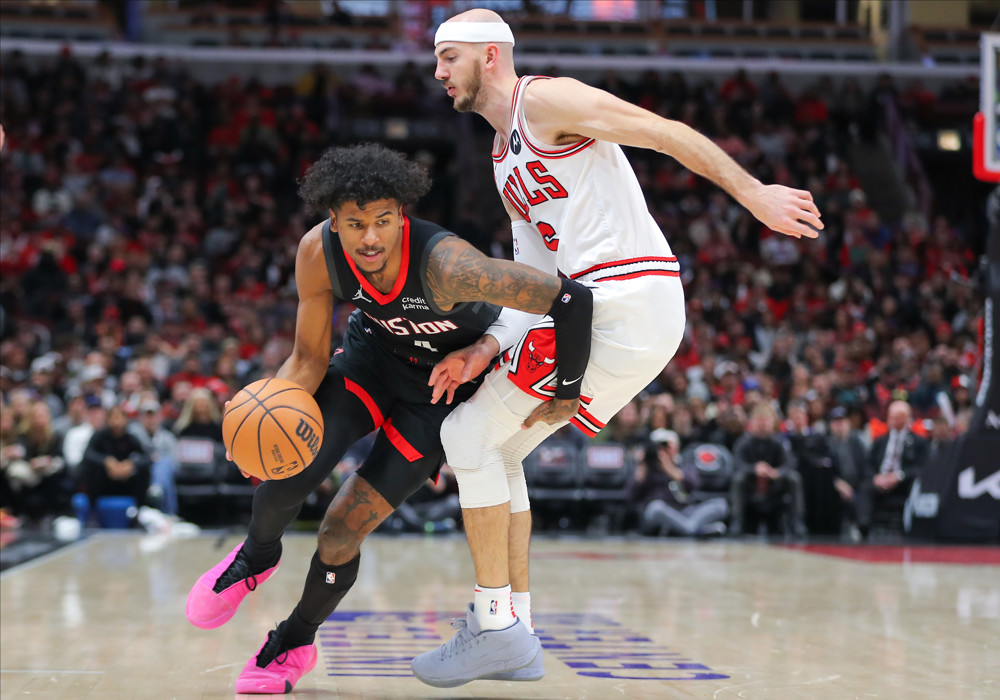
Jalen Green’s Ascension
Jalen Green has had an up-and-down career throughout his first three seasons in the league. Always an explosive athlete, Green’s shooting and decision making have been two of his biggest areas of improvement since his time with the G-League Ignite.
Even before the change in the starting lineup, Green was in the process of elevating his game to another level. Throughout the month of March, Green had upped his 3-point volume and percentage. Along with this, his actual effective field goal percentage was an impressive 6.3% higher than his expected effective field goal percentage (something we track).
The young guard’s improvement is not only due to some hot shooting, he has increased his on ball opportunities and advantages created as shown below:
| Pre Şengün Injury (minimum 1000 possessions) | Post Şengün Injury (minimum 250 possessions) | |
| Ball-Handler Opps* (per 100 possessions) | 58 (79th percentile) | 70 (88th) |
| Advantages Created** (per 100 possessions) | 11.6 (72nd percentile) | 15.1 (87th percentile) |
*Opps: Number of on-ball opportunities given the user-defined filters.
**Advantage Created: Player creates an advantage for their team; an advantage is deemed to be created if the team can generate a high-value shot off of the player’s action.
If Green can come close to sustaining this level of play, it would alter not only their outlook for the end of the season, but significantly brighten their long term future.
Amen Thompson Fitting In
Rookie Amen Thompson has been living up to his middle name, “XLNC” (pronounced “Excellence”) with his recent play. Thompson has molded his game to fit the Rockets needs throughout the season.
Starting off as a steady defender off the bench, Thompson has steadily improved and has been rewarded with a bigger role as the season has progressed. First stepping in for injured starter Fred VanVleet as the team’s nominal point guard. Now Thompson is once again a starter, but this time acting as more of a big than a guard.
With the absence of a traditional center, Thompson has found a new opportunity to act as the team’s screener in pick & rolls. Putting him in actions as the screener limits his liability as a shooter while placing him in the optimal situation to show off his passing and explosion.
Big plus for the Rockets during this stretch: using Amen Thompson as a screener and opening him up on the roll. pic.twitter.com/RSXzuhy7lb
— Steve Jones Jr. (@stevejones20) March 16, 2024
| Pre Şengün Injury (minimum 500 possessions) | Post Şengün Injury (minimum 250 possessions) | |
| Screener Opps (per 100 possessions) | 2.9 (17th percentile) | 18 (75th percentile) |
| Advantages Created as a Screener (per 100 possessions) | .1 (18th percentile) | 1.3 (83rd percentile) |
Thompson has proved to be a dual threat on the roll, being able to make passing reads on the short roll or use his explosion to finish through the rotating help at the rim.
Screening is not the only thing Thompson does like a big man either. Among guards, Thompson ranks in the 98th percentile in contested offensive rebounds and the 89th percentile in contested defensive rebounds, respectively.
Amen Thompson has clearly found great success in his new role, which speaks to his multifaceted skill set, and it will be of great interest to see how this role grows and changes into next season.
Looking Ahead
The Rockets will continue their strong push towards the Play-In, with a crucial game against Golden State on Thursday. Whether they make the Play-In or not should not be the deciding point on whether this season was a success.
This team improved massively compared to last season. It withstood and adapted to one of its most important players getting injured.
There is even a possibility that it found an ideal way to play and can use that information to shape its roster this offseason and beyond.