Sports Info Solutions
Category: NFL
-
Which QBs received the most/least help from receivers on completions?
By
By John Shirley Here at Sports Info Solutions our video scouts chart many things within each NFL game, including multiple in-depth data points pertaining to quarterback accuracy. Our in-depth quarterback accuracy is charted on three scales: Whether the pass was Completed Whether the pass was Catchable Whether the pass was On-Target (Includes throws that are…
-
Who were the top red zone receivers among NFL prospects?
By
Which receiving prospects can handle the pressure of catching and scoring from in close?
-
Who improved/lost the most at each position in NFL free agency?
By
Examining how teams fared with different position groups. Which team gained/lost the most at QB, on the offensive line, and so forth.
-
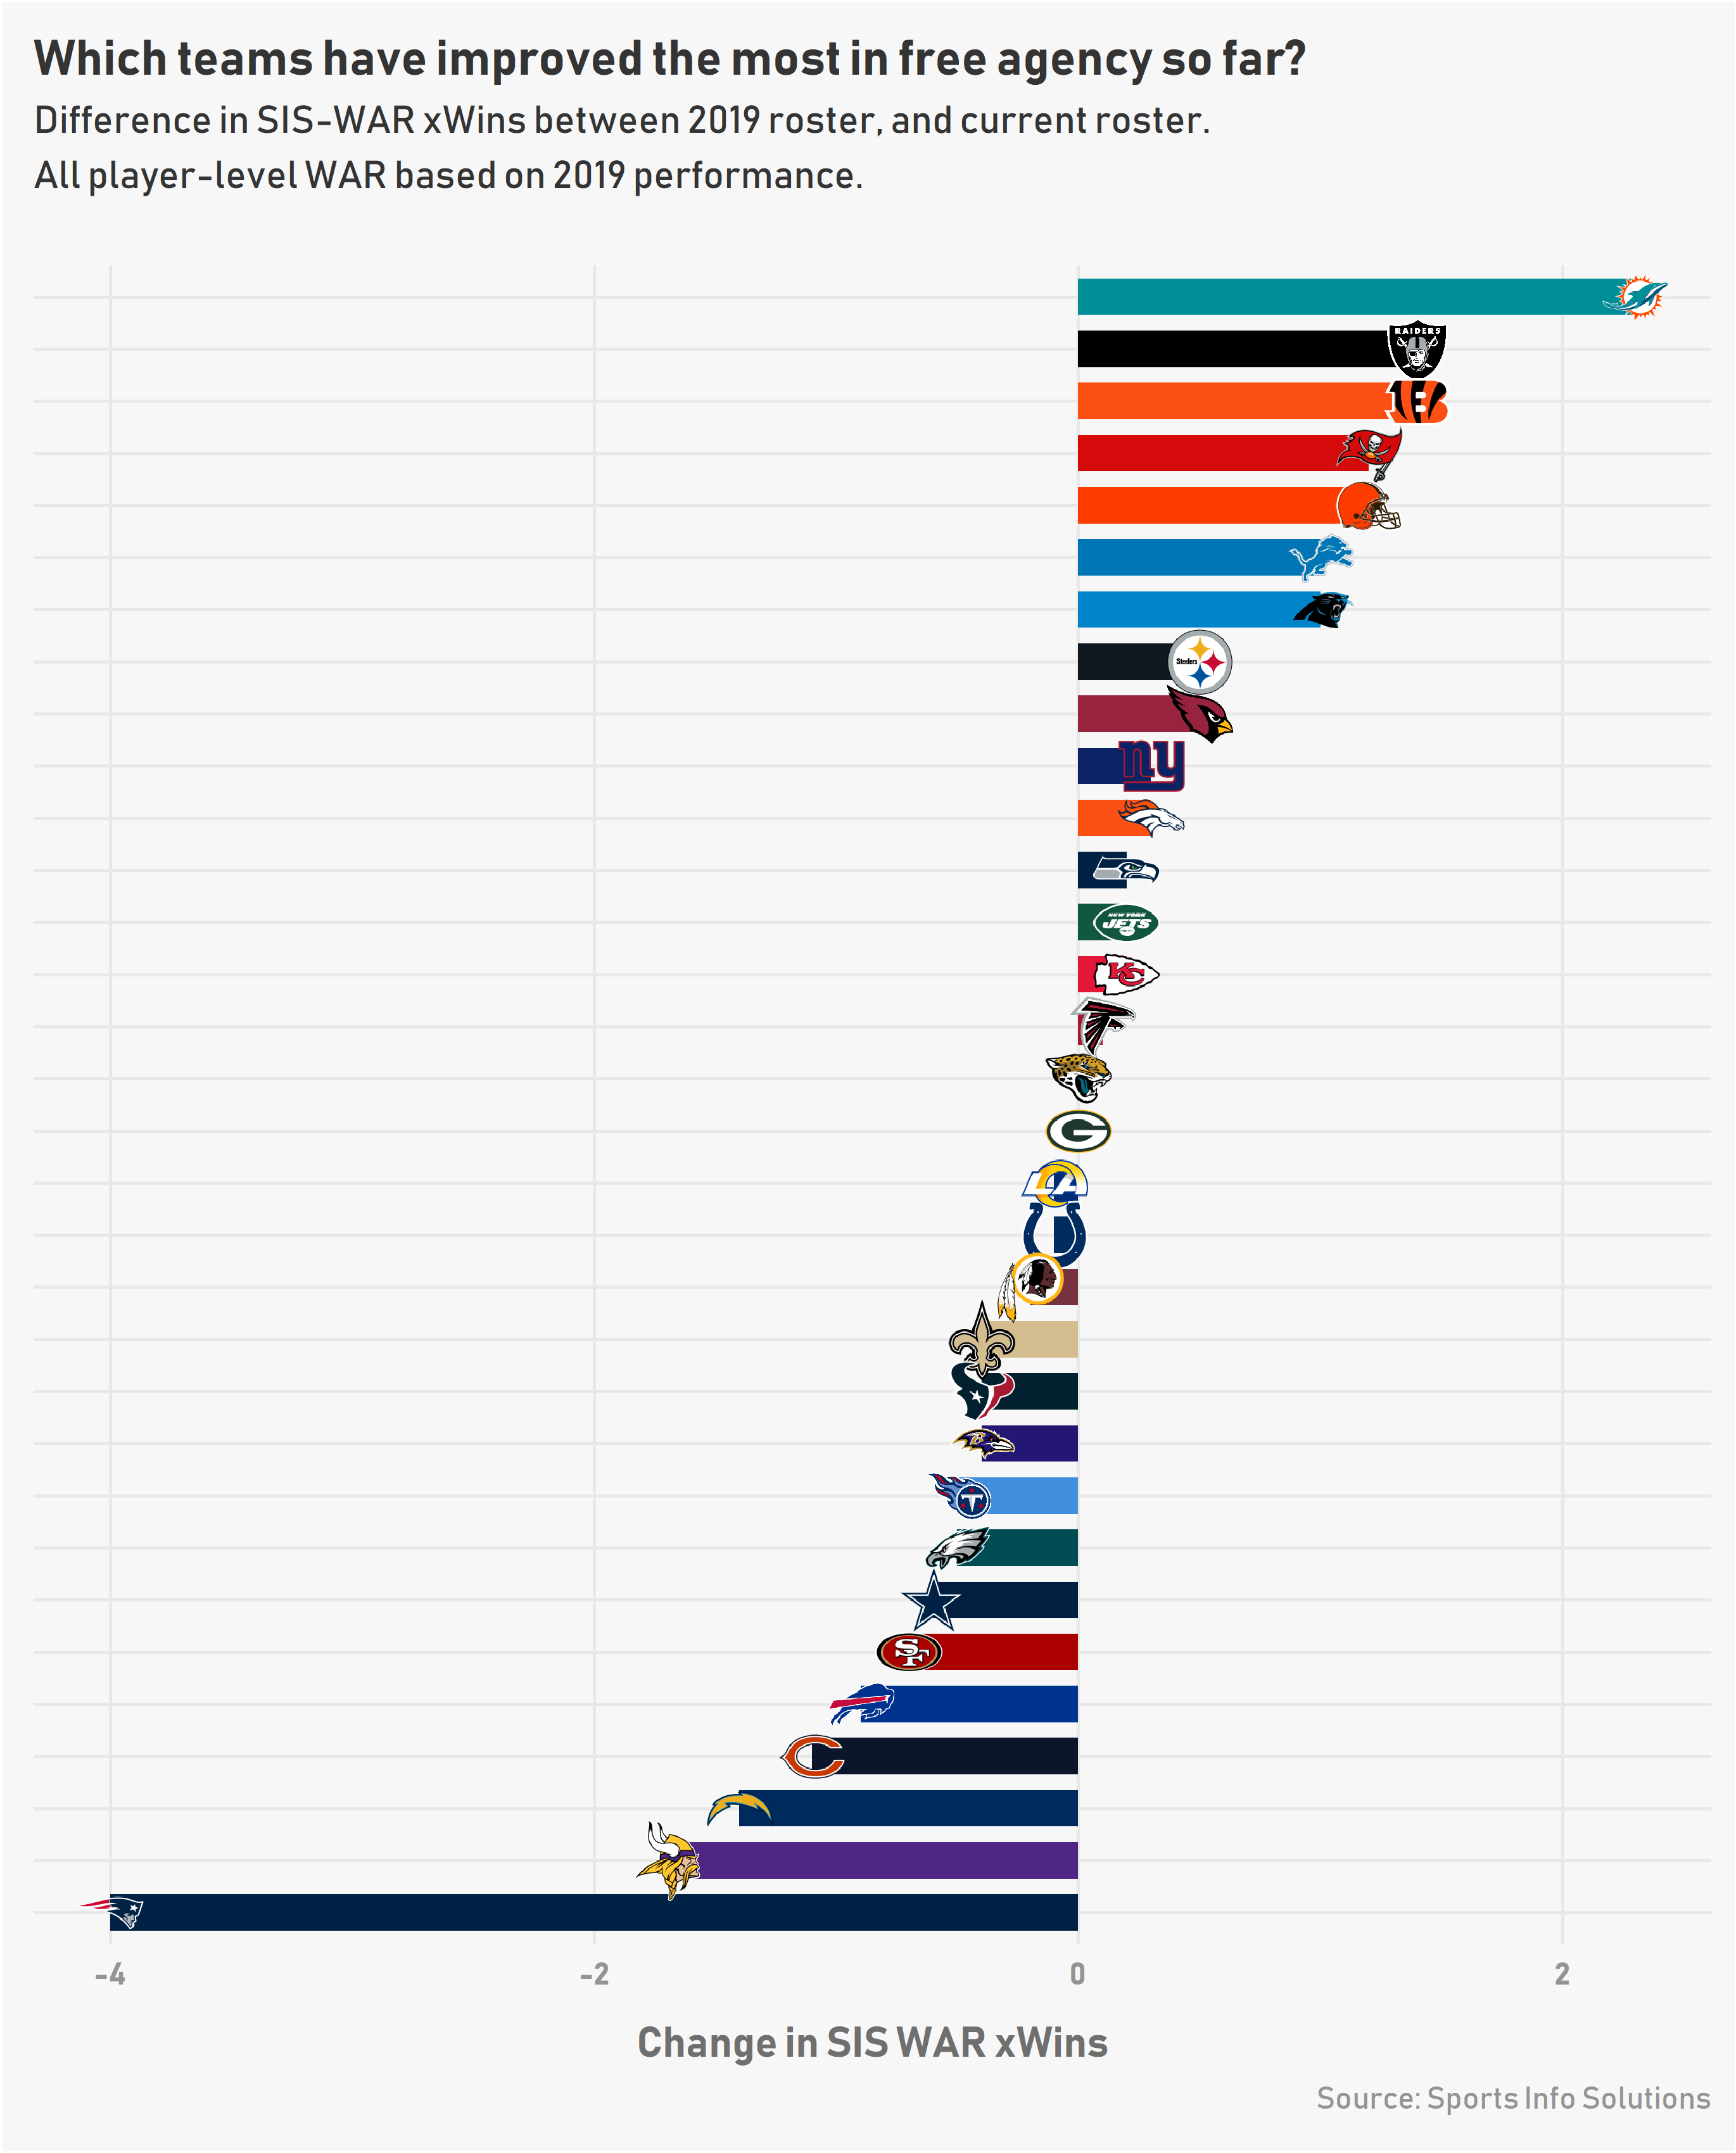
The Winners and Losers of the NFL Offseason… So Far
By
Based on SIS’s proprietary WAR metric, which teams have added or lost the most value so far this offseason?
-
Who were some of the NFL’s best values in free agency? (Part 2)
By
We use our Total Points stat to assess which teams got the most production for their dollar.
-
Stat-Based NFL Player Comparisons for the 2020 QB Class
By
Joe Burrow = Baker Mayfield? Jalen Hurts = Kyler Murray? There’s math to how we got those comparisons.
-
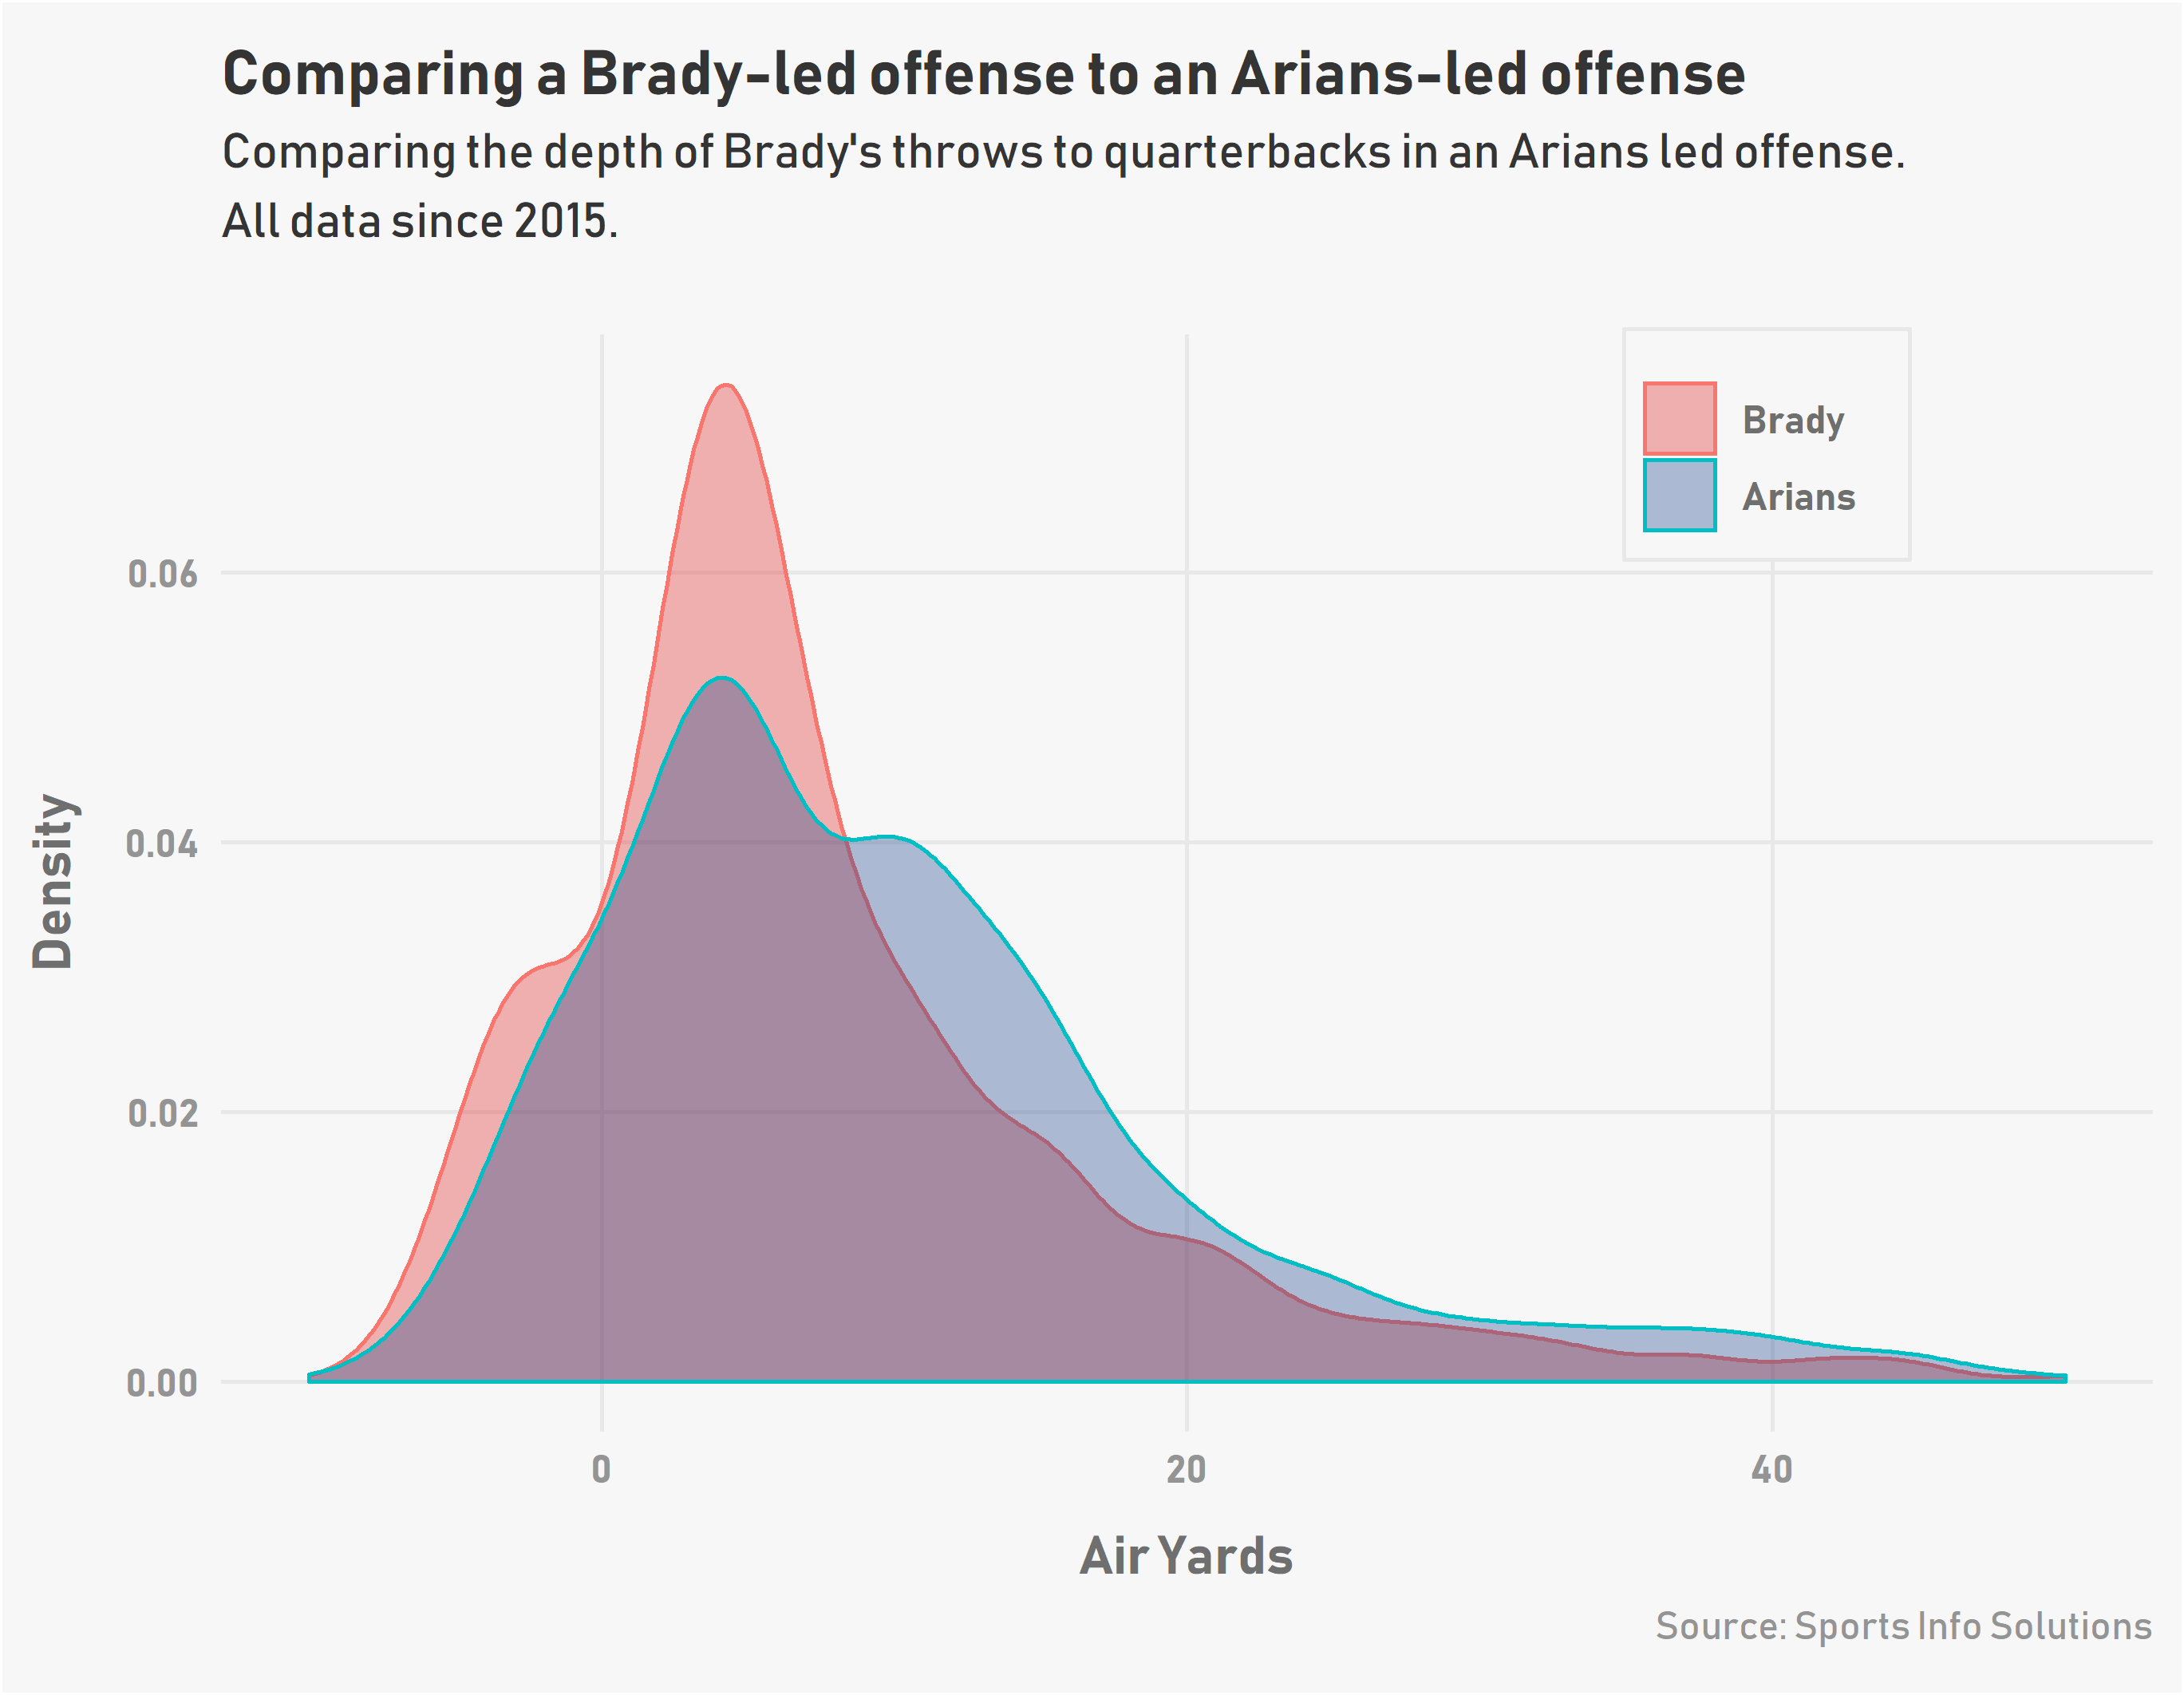
How does Tom Brady fit into a Bruce Arians offense?
By
Does Brady do the things that Bruce Arians likes?
-
Evaluating the best values in free agency by our Total Points metric
By
The really good buys seem to be coming on the defensive side. We explore the best ones using Total Points.
-
New football podcast: Super Bowl props and previews
By
Who do Matt, Aaron, and Corey think is going to win (and how)?
-
New football podcast: AFC/NFC Championship Game Review
By
Newest episode of the Off the Charts Football Podcast