By: John Shirley
Within the 2020 SIS Rookie Handbook, we provided a look at how well some player-level quarterback metrics correlate between the NCAA and the NFL. The following table and excerpt from the Handbook summarizes the results:
Correlation of QB Rate Metrics
| Metric | NFL Year-to-Year (n=71) | Final NCAA Season to NFL Career (n=20) |
| Scramble% | 0.76 | 0.50 |
| ADoT | 0.41 | 0.40 |
| Catchable% | 0.48 | 0.33 |
| ADoC | 0.33 | 0.29 |
| Comp% | 0.49 | 0.22 |
| Sack% | 0.34 | 0.04 |
| EPA/DB | 0.33 | 0.04 |
| TD/INT | 0.32 | 0.03 |
| Y/A | 0.31 | 0.00 |
“The metrics that correlate the highest year-to-year are the ones that measure what quarterbacks have the most control over: accuracy (Catchable%), aggressiveness (ADoT), and the decision to scramble (Scramble%). These are also the same things that have a high correlation from college to the NFL. Performance value metrics have much lower year-to-year correlations and NCAA to NFL correlations, most likely due to the fact that these measure overall offensive performance instead of direct quarterback performance.“
“SIS’s Total Points value metric shows relative stability at the NFL level (correlation = .45), but as we only have NCAA Total Points data for 2018 and 2019, we do not have a large enough sample to model a relationship. This is also a drawback for all of the quarterback metrics, as any relationship based on a sample size of 20 should be taken as a first glimpse and not gospel.”
Using this information, we can see that the top five metrics (Scramble%, ADoT, Catchable%, ADoC, and Completion%) show some relationship between a player’s performance in college and his performance in the NFL. By using these metrics and historical college data from previous draft classes, we can compare this season’s quarterback prospects to the college performance of current NFL players. We’ll use a similarity score on the scale of 0 to 100, with a higher number representing a more similar player.
Results
| SIS Rookie Handbook Position Rank | Player | Most Similar Player | Similarity Score |
| 1 | Joe Burrow | Baker Mayfield | 73 |
| 2 | Tua Tagovailoa | Dwayne Haskins | 86 |
| 3 | Justin Herbert | Deshaun Watson | 92 |
| 4 | Jordan Love | Sam Darnold | 81 |
| 5 | Jacob Eason | Drew Lock | 89 |
| 6 | Jake Fromm | Cooper Rush | 88 |
| 7 | Tyler Huntley | Jake Browning | 69 |
| 8 | Jalen Hurts | Kyler Murray | 74 |
| 9 | Anthony Gordon | Gardner Minshew II | 84 |
| 10 | Steven Montez | Daniel Jones | 87 |
| Season | Player | Scramble% | ADoT | Catchable% | ADoC | Comp% |
| 2017 | Baker Mayfield | 5.7% | 10.7 | 88.3% | 8.1 | 70.5% |
| 2019 | Joe Burrow | 7.4% | 9.1 | 91.2% | 7.7 | 76.3% |
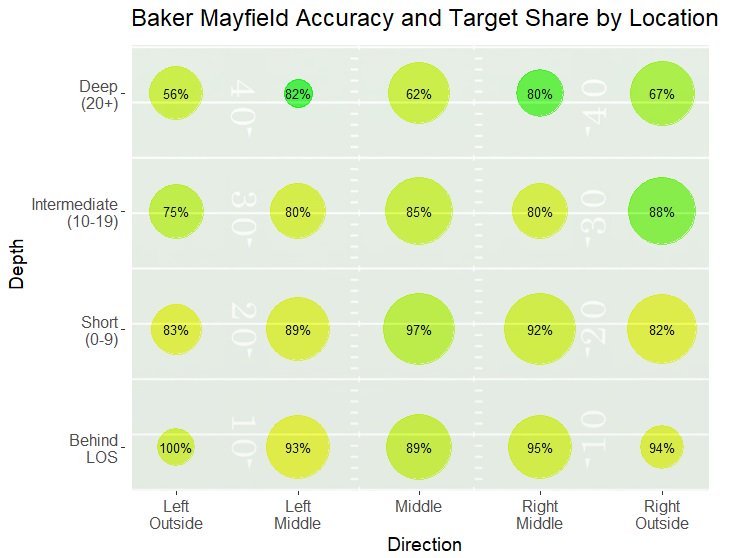
Joe Burrow’s closest statistical comparison is fellow Heisman winner Baker Mayfield. Although, this is one of the weaker comparisons among the group. This is mainly due to how incredible Burrow’s season was. There are not many other quarterbacks that can compare to his high-level accuracy, while also pushing the ball down the field with an ADoT of 9.1.
| Season | Player | Scramble% | ADoT | Catchable% | ADoC | Comp% |
| 2018 | Dwayne Haskins | 5.0% | 7.9 | 85.3% | 6.3 | 70.0% |
| 2019 | Tua Tagovailoa | 4.0% | 8.3 | 87.8% | 6.1 | 71.4% |
If this result surprises you because of the difference in stature between the two quarterbacks, maybe their similar stat lines convince you otherwise. It’s worth noting that if we include height as a variable in our model, Deshaun Watson becomes Tua’s strongest comparison.
| Season | Player | Scramble% | ADoT | Catchable% | ADoC | Comp% |
| 2016 | Deshaun Watson | 4.0% | 8.5 | 85.1% | 5.6 | 67.0% |
| 2019 | Justin Herbert | 4.0% | 8.4 | 83.4% | 5.8 | 66.7% |
Justin Herbert and Deshaun Watson have the highest similarity score among the group, and when you look at their near-identical key statistics, it’s easy to see why. That said, if the 4 inch difference height between the two is too much for you to see past (pun intended), our height-inclusive model pegs Daniel Jones as most similar to Herbert, albeit with a similarity score of just 77.
How It Works
The first part of creating the similarity scores is to normalize the five input metrics, which essentially means that we are adjusting them so that they are all on the same scale of 0 to 1.
We can then input the normalized metrics into the distance formula, which compares all players to each other and measures how far apart each player is based on the inputs. So, players with similar metrics will have short distances, while players with wildly different performances will be far apart.
The final part of the process is to create a similarity score out of the distances. This will be done by using the formula: 1 / (1+Distance). The final output will be a similarity score on the scale of 0 to 100, with a higher number representing a more similar player.
This doesn’t mean each player will have a similar NFL career path as their comparison. But, it can be a fun and useful way of analyzing prospects. For more in-depth stats and full scouting reports on the entire 2020 draft class purchase the 2020 SIS Rookie Handbook.


