Sports Info Solutions
Category: Football
-

-
World’s No. 1 QB Rankings: Matthew Stafford & Kyler Murray Soar
By
These 2 quarterbacks have made notable ascents in 2021. Here’s what went into it.
-
Off The Charts Podcast: Backup QB Revolution & Week 9 Preview
By
Talking Geno Smith, Trevor Siemian and more – plus what to expect from Jordan Love.
-
Prop recommendations: Jets vs Colts
By
Michael Carter and Jonathan Taylor factor strongly into our recommendations.
-

Top Prop Bet Options for Cardinals-Packers
By
With Packers pass-catchers out of the mix, we have to look at different options.
-
SIS Football Newsletter – Week 7
By
Everything you need for your Fantasy Football Sunday – from which corners are vulnerable to in-depth QB assessments – and much more.
-
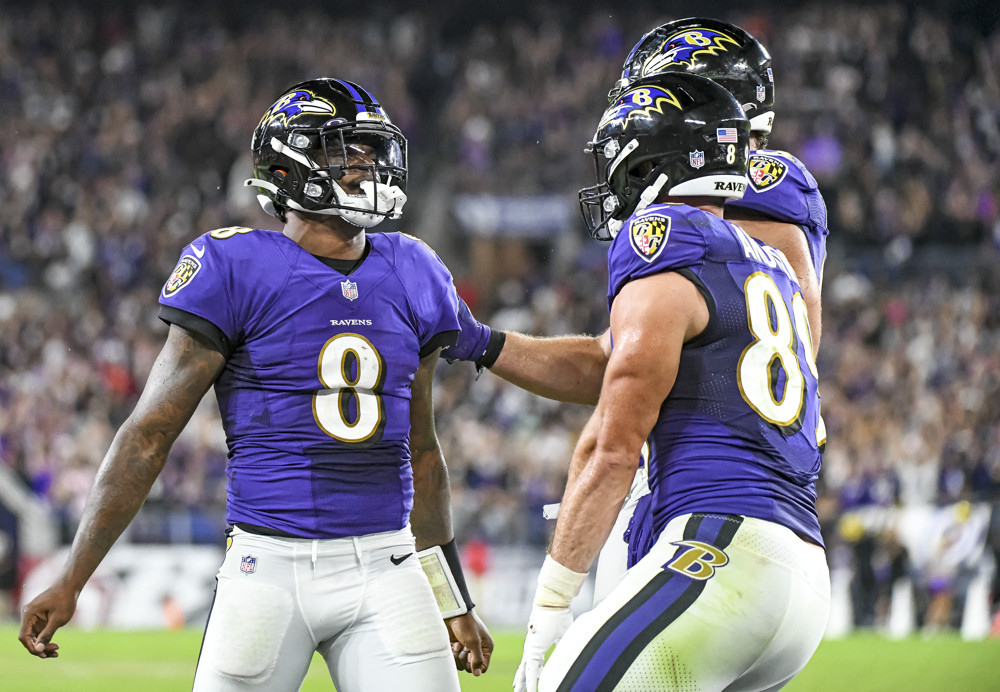
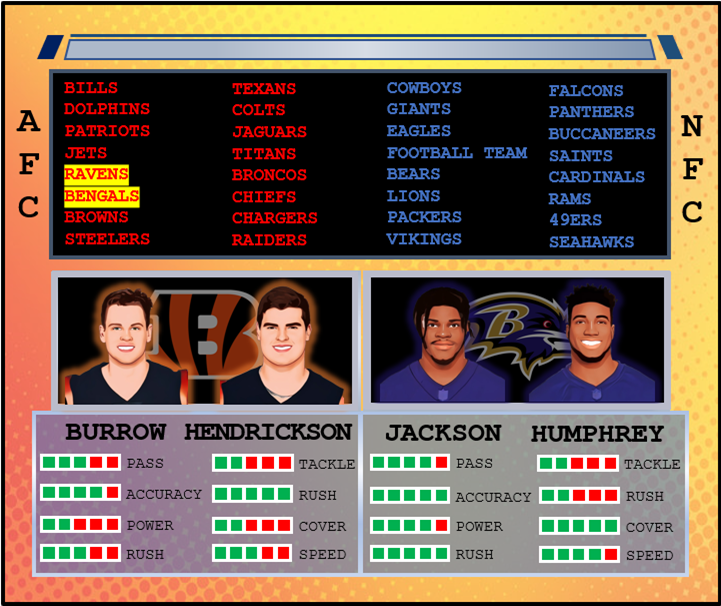
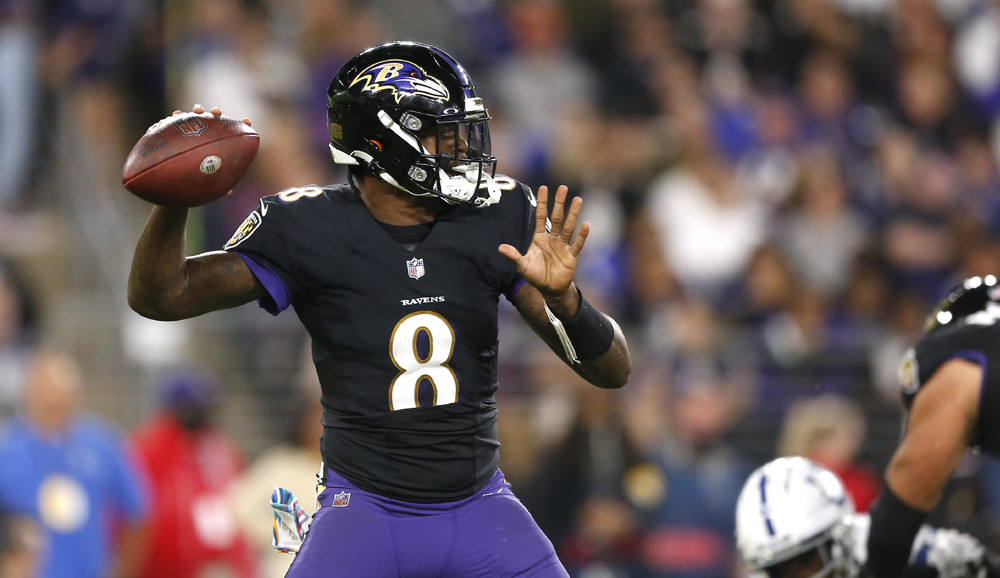
Can’t We Just Celebrate Lamar Jackson’s Excellence?
By
We’re tired of the codified language. The numbers show Jackson is a complete QB
-
New Off The Charts: What Has The Most Watchability?
By
Previewing Week 7s games and taking a look at what teams have been doing on 4th-and-short.
-
SIS Football Newsletter – Week 6
By
A look at the Total Points Power Rankings, the Chargers-Ravens game, Big Ben & Brady, and more.
-
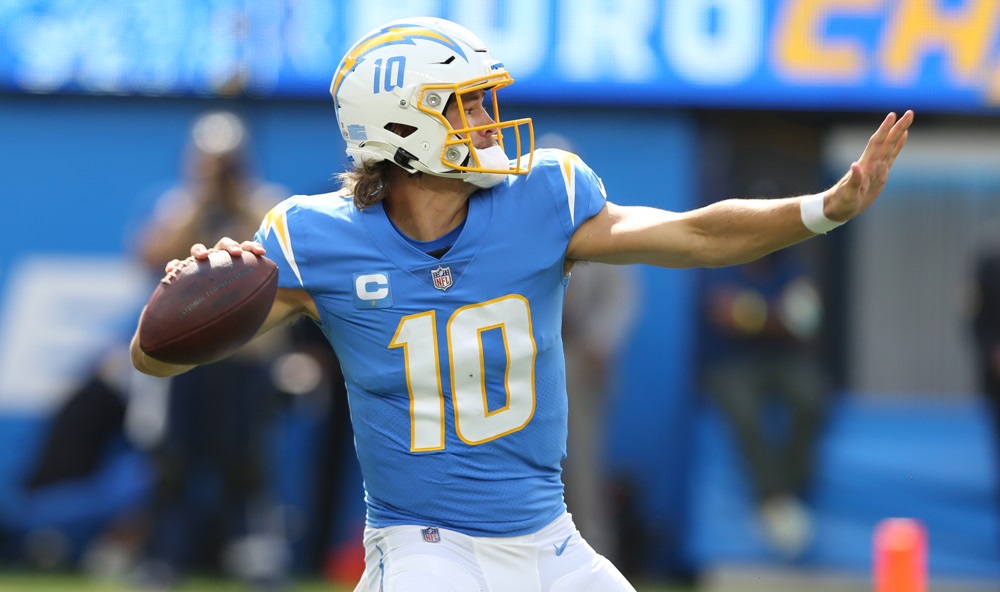
World’s #1 QB: Justin Herbert Makes His Move
By
Explaining why Herbert is where he is in our rankings – and why Kirk Cousins is now No. 4