|
|
|

|

|
|
|
|
|

|
|

|
|
|
|
|
|
|
|
|
|
|
|
|
|
|
|
|
|
|
|
|
By BRYCE ROSSLER
“The league will figure him out this year.”
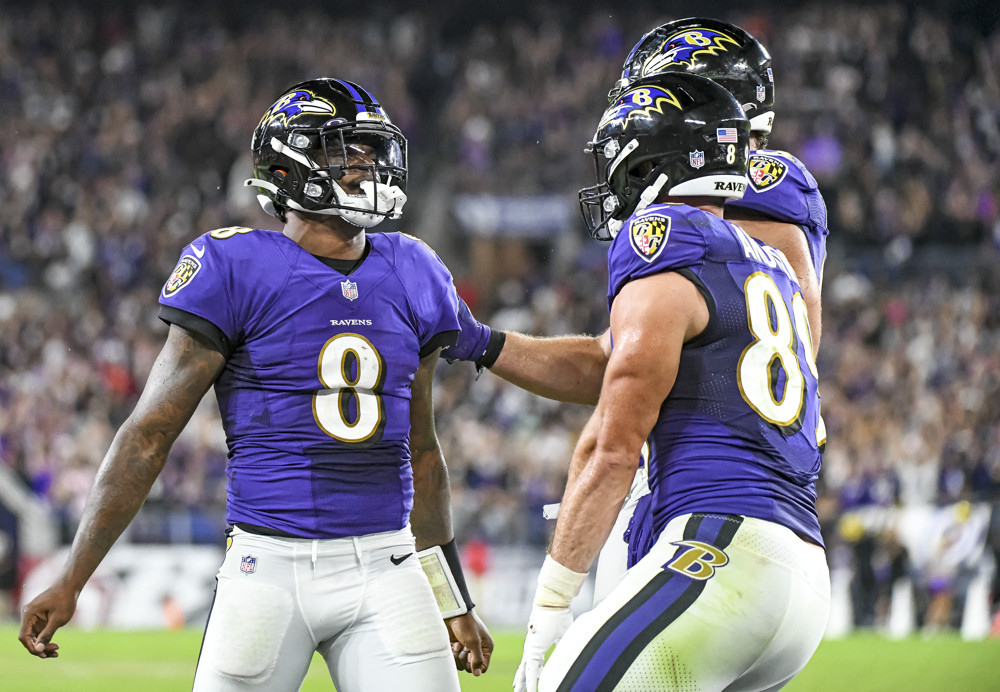
That was how anonymous league personnel chose to besmirch NFL MVP Lamar Jackson in an ESPN story this past offseason. Of course, this sentiment was as toothless as the shadowy figures who made it, and what was already a disqualifying thought looks even worse with Jackson once again playing at an MVP level.
Jackson’s excellence is nothing new, and neither is the ugly reality that black quarterbacks are held to a higher standard than their white counterparts.
Codified language and dog whistling pervade discussions of Jackson’s game. The notion that he’s just a scrambler could be called a common misconception were it not for the fact that such a label is often deliberate and made in bad faith. Some even refer to Jackson as a ‘running back,’ which is football-illiterate at best and racist at worst.
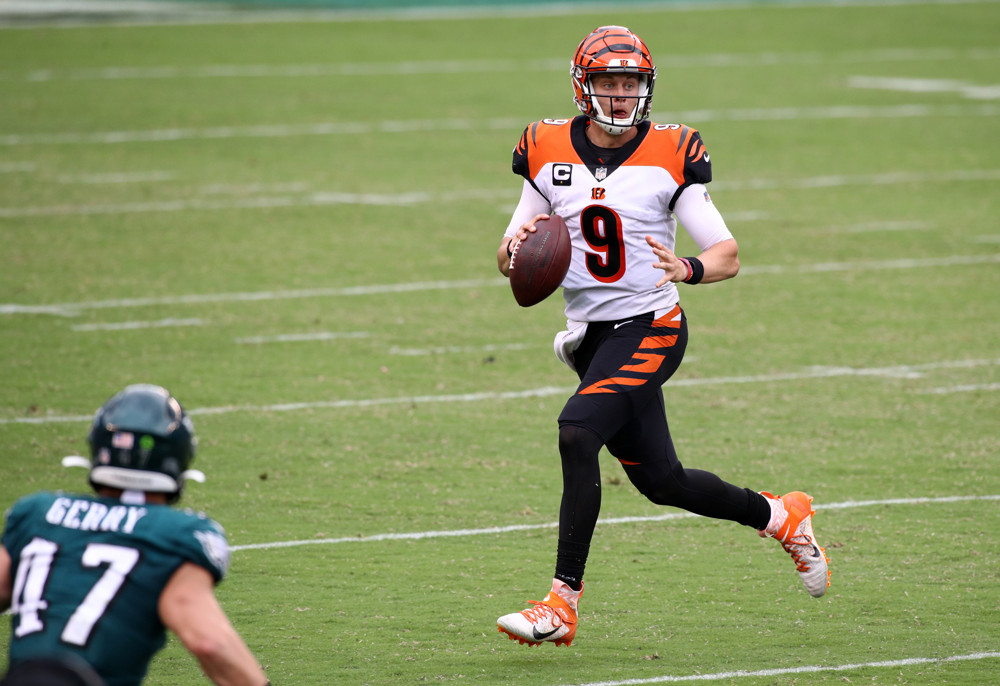
If you don’t believe me, consider how differently Jackson’s 2018 classmate Josh Allen has been talked about. Some of the criticism that still dogs the former applied to the latter earlier in his career. Allen was regarded as an inaccurate gunslinger who struggled to read the field and play within structure.
In 2021, Allen and Jackson both rank in the top five in both designed QB runs and scrambles, but Allen is worse than Jackson in adjusted time to throw, turnover-worthy play rate, and virtually every accuracy metric.
And yet, so many were ready to accept that Allen was suddenly good after one (1) Pro Bowl season, despite struggling mightily at both the college and NFL levels until that point. Why, then, do some people continue to levy similar criticisms at a former Heisman winner and NFL MVP?
Regardless, it would be a disservice to Jackson to focus on one specific player comparison. Through six games, Jackson ranks 2nd among all players in Total Points, 6th in Passing Total Points (5th on a per-play basis), and 5th in Rushing Total Points (and that includes running backs). And while it’s important to note that he’s outdueling many of his peers, he’s also outdoing himself.
Jackson ranks in the top six in both Passing Total Points and Rushing Total Points.
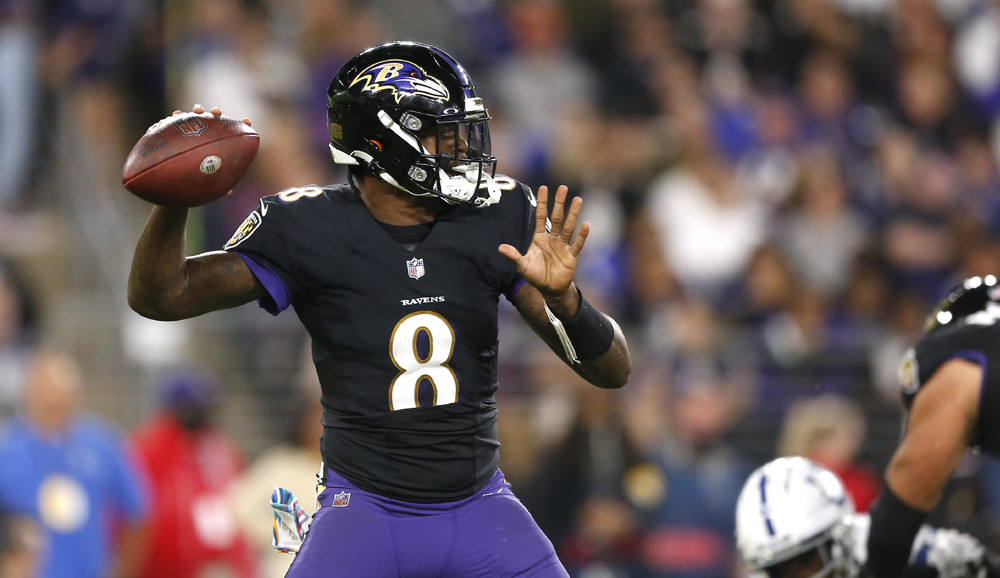
The Ravens signal-caller is performing even better than he did during his MVP season. His On-Target +/- rate is +3.4%, which ranks 7th in the league and is up more than a full percentage point from 2019 (+2.3%).
For those unfamiliar, that stat measures a quarterback’s accuracy taking into account the difficulty of the throw, including factors like distance, pressure, and coverage.
Jackson’s turnover-worthy throw rate has slightly increased from 2019 (1.7%) to 2021 (2.1%), and that’s meaningful because that’s a couple potential extra turnovers a season. But he’s still among the ten best in this metric despite having gotten more aggressive about throwing deep and attacking the middle of the field, two danger areas for quarterbacks. His league-leading average depth of target (9.9) is up more than a full yard over 2019, and 59% of his passes have hit in the middle of the field, compared to 56% in 2019. And in case you were wondering, he’s still top ten at protecting the football across all touches if we include fumbles.
He’s also operating with improved timing. While Jackson’s playstyle will never lend itself to a low adjusted time-to-throw stat, he’s getting the ball out 0.10 seconds faster than he did in 2020, the first year SIS began collecting snap to throw times. The average person rarely ever thinks about time in fractions of a second, but a split second is a long time in a game of inches While Jackson has never really struggled with seeing the field, this could be seen as a sign that he’s processing faster than he did before.
Of course, Jackson has never really had a problem playing from the pocket. He ranked 4th in 2019 in Passing Total Points / 60 Snaps from the pocket (13.7) and has continued that trend this year, ranking 5th (14.0).
So, regardless of what your perception of these baselines was coming into this season, there’s a lot of statistical evidence to support the idea that Jackson, at age 24, is still improving. Furthermore, he’s just generally been more efficient than he was during his MVP campaign. His Passing Total Points / 60 Snaps has improved from 13.1 in 2019 (which ranked 5th) to 15.3 this year (4th).
Of course, I would be remiss not to mention that he’s still arguably the most dynamic runner in the league. His broken + missed tackle rate of 33% comfortably leads the league by five percentage points, but I don’t want to harp too much on his running ability because Jackson is so much more than just a runner.
Jackson is one of the game’s brightest young stars and a legitimate dual-threat who is beating teams with his arm and his legs, both inside and outside of structure. He can hurt you from the pocket or on the move, and he’s a threat on designed runs and scrambles alike. Put simply: he’s damn hard to stop.
There. I just figured Lamar Jackson out.
On today’s episode, Matt Manocherian (@mattmano) and Alex Vigderman (@vigmanoncampus) do a thorough review of NFL Week 6 and look ahead to Week 7.
First up on the topics list is a Total Points Power Ranking (), followed by a closer look at the go-for-it approach of the Bills against the Titans ().
Matt and Alex then discuss the staying power of the Cardinals, Bengals, and Raiders ().
The guys then preview Ravens-Bengals (), Titans-Chiefs (), Eagles-Raiders (), and Saints-Seahawks (), with a focus on the game elements with the highest watchability factor.
We close with another Scouts vs Stats take on which NFL broadcasters provide the most interesting insight in each area ().
by COREY MARCH
The Bills prevailed in last week’s heavyweight matchup against the Chiefs by exposing their soft defense. As a result, Buffalo (+250) jumped ahead of Kansas City (+350) as the favorites to win the AFC per DK Sportsbook.
According to this week’s Weekly Total Points StatPack, the Chiefs are the league’s worst defense. Arizona defended their unblemished record but it wasn’t enough to hold off Tampa Bay from swooping in to claim the title as “#1 Team in Total Points”.
Total Points Power Rankings (Top-5):
> If you like the SIS Football Newsletter, subscribe to have it emailed to you each week.
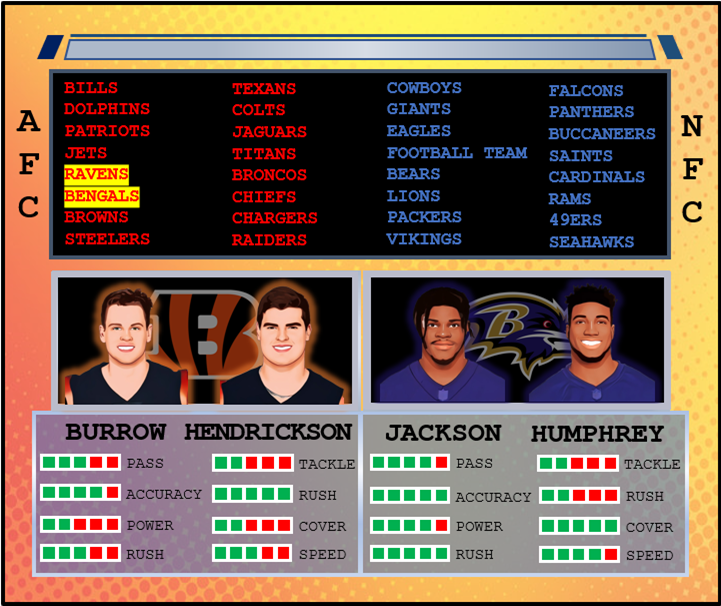
FEATURED GAME – CHARGERS at RAVENS
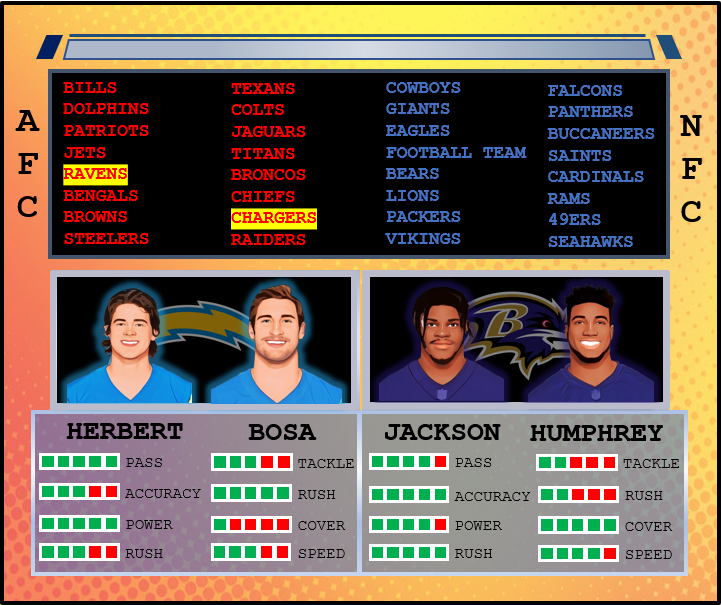

Justin Herbert and Lamar Jackson are each coming off spectacular Week 5 performances, complete with late game heroics. The Chargers and Ravens each sit at 4-1 and are favorites to win two of the most hotly-contested divisions. Both teams have had to overcome fourth quarter deficits in four-of-five games, so depending on who you ask, their impressive records are either lucky or that much more impressive.
The Ravens had their record-tying streak of 43 straight 100-yard rushing games snapped last week. This is an opportunity to get their running game back on track against a Chargers run defense that ranks last in several key categories including 158 yards per game and 3.4 average yards before contact. There are a few betting indicators to follow here, too. The public is all over LAC with 80% of tickets coming in on the underdog (per Action Network). This game also falls into an age-old betting trap: a 1:00pm start for a west coast team.
THE PICK: RAVENS -2.5
![]()
Ben Roethlisberger and Tom Brady: A Tale of Two Aging QBs
Rewind to Week 13 last season. The Steelers entered with a perfect record and some expectation they would finish the regular season that way. The Buccaneers limped into their bye at 7-5, losers of three of their last four, and fresh off a defeat against the Chiefs where they surrendered 269 receiving yards to Tyreek Hill.
My how things have changed.
After their undefeated 11-0 start, the Steelers have gone 3-8 in their last 11 games leading up to today.
Meanwhile, the Buccaneers are 13-1 over that span, which included seven consecutive wins out of their bye that culminated in a Super Bowl title.
The driving force between these two diverging teams has been their quarterback play.
44-year-old Tom Brady has led the league by a wide margin with 146 Passing Points Earned, while the opposite is true for 39-year-old Ben Roethlisberger, who has distanced himself in last at minus-21.
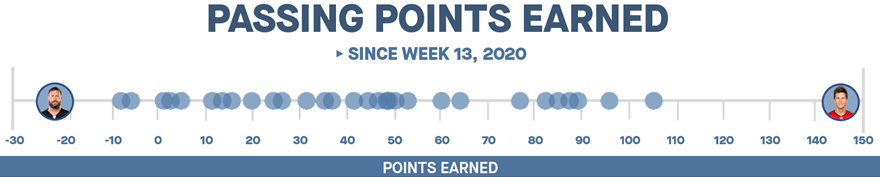
Roethlisberger and Brady had produced similar results through the first 12 weeks last season, but it’s been a much different story from that point forward.
Weeks 1-12 (2020)
Ben: 49% Positive Play Rate | 23% Boom Rate | 14% Bust Rate
Tom: 49% Positive Play Rate | 25% Boom Rate | 13% Bust Rate
Weeks 13-Playoffs (2020), Weeks 1-5 (2021)
Ben: 44% Positive Play Rate | 17% Boom Rate | 17% Bust Rate
Tom: 53% Positive Play Rate | 28% Boom Rate | 13% Bust Rate
Their willingness to throw downfield has also set them apart. Dating back to last season, Brady has thrown past the sticks on a robust 49% of his throws, while Roethlisberger checks in at just 39% (NFL avg = 41%).
Despite being five years his elder, it appears Brady has a lot more left in the tank than Big Ben.
![]()
PPR Points Allowed by Position
In today’s competitive fantasy football space, it’s no longer enough to broadly categorize an opposing defense as “good” or “bad” based on the total numbers of yards or points allowed.
We have the capability to slice and dice data to generate splits that give us all kinds of deeper insight.
Here we will look at total PPR fantasy points allowed through the air, broken down by four position groups: Slot Receivers, Wide Receivers, Tight Ends, and Running Backs in that order:
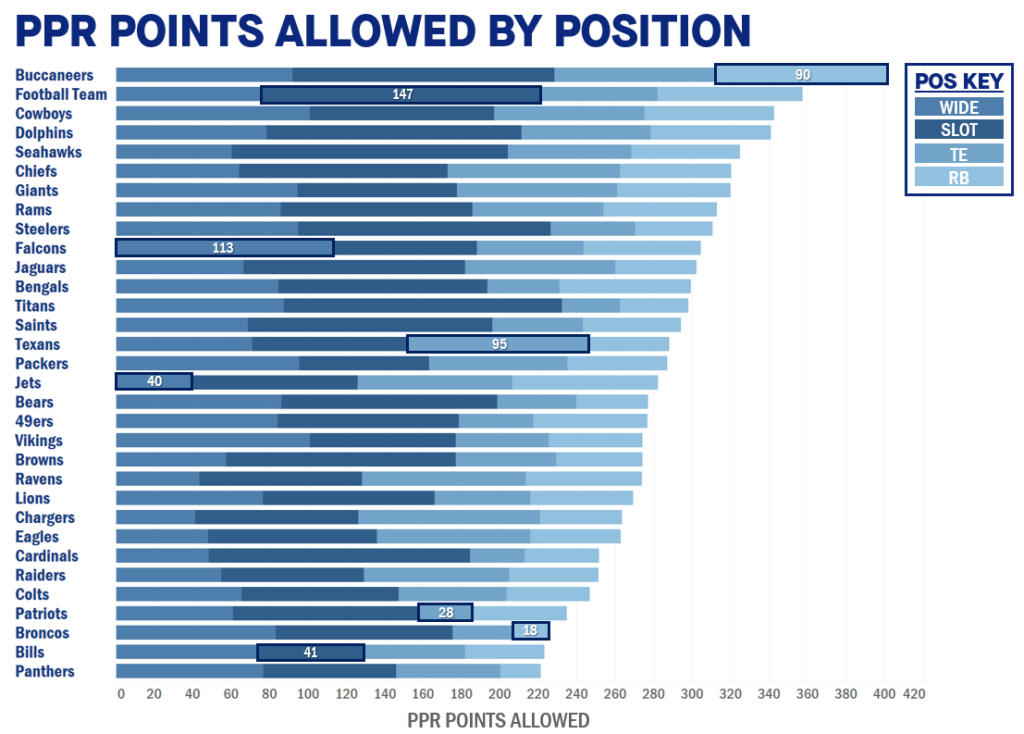
Highlighted are the teams that have allowed the most and fewest points by position group. For example, WFT has allowed the most points to Slot Receivers, while Buffalo has allowed the fewest.
An interesting takeaway from looking at the numbers is the percentage of PPR points scored by each position group:
By ALEX VIGDERMAN
Earlier this week, Timo Riske of Pro Football Focus tweeted the names of nine quarterbacks that everyone should have in their Top 10 QB list.
I feel like every top 10 QB list right now has to include the following names in some order
Herbert
Kyler
Lamar
Allen
Brady
Rodgers
Dak
Russell
MahomesWho is the 10th?
— Timo Riske (@PFF_Moo) October 12, 2021
SIS’s World’s #1 QB Rankings differ slightly from that list, but that’s partly due to some extenuating circumstances.
Here’s where we stand after Week 5:
SIS World’s #1 Quarterback Rankings Through Week 5 2021
1. Patrick Mahomes
2. Tom Brady
3. Aaron Rodgers
4. Kirk Cousins
5. Lamar Jackson (up by 1)
6. Justin Herbert (up by 2)
7. Josh Allen (up by 2)
8. Deshaun Watson (down by 3)
9. Matthew Stafford (up by 1)
10. Russell Wilson (down by 3)
11. Kyler Murray (up by 1)
…
14. Dak Prescott
A reminder that The World’s No. 1 Quarterback Ranking is based on a model devised by Bill James to evaluate The World’s No. 1 Starting Pitcher. Bill’s model was based on cumulative evaluation of individual starts over an extended time period using the metric Game Score.
The World’s No. 1 Quarterback Ranking uses our player value stat Total Points to make a cumulative evaluation of game performance over a three-year period. The key to our calculation is Points Above Average (PAA), which is the statistical underpinning of Total Points that is centered at zero so that positive numbers are above average and negative numbers are below average.
Success over time is key to maintaining a good ranking. Prolonged inactivity results in a ranking drop. The most recent performances carry the most weight
As the model looks at multiple years of data, availability plays a big part in a player’s ranking. That explains why Russell Wilson fell a bit (and will continue to fall through his injury absence). Dak Prescott has the same fate, thanks to his 2020 shoulder injury. And we know the story with Deshaun Watson, who has slowly dropped down the rankings as the season has gone on.
Kirk Cousins crashes the party at 4, which we probably understand is overstating his talent relative to the names behind him, but is reflective of a consistency in availability and performance that he hadn’t attained previously.
Kirk Cousins has been Mahomesian for stretches, but then fallen back down towards average for a sustained period.
He's managed to put less distance between those peaks than he usually does, which is enough to surpass some of the guys ahead of him who slipped. https://t.co/OGlPPF59z9 pic.twitter.com/YdCkqHGtzm
— Alex Vigderman (@VigManOnCampus) October 1, 2021
Given recent returns, it’s very likely that Cousins’ hold on that 4 spot isn’t long for this world. We have already written about Lamar Jackson’s big year in this space, and he went ahead in Week 5 and had his best game by Points Above Average since his MVP season. Throwing for more than 10 yards per attempt on 40 attempts with four touchdowns and no interceptions will do that for you.
Justin Herbert is the next name to have crashed the preseason top 10. He’s posted two of the five best starts of his (admittedly brief) career in just the last three games, trailing only Jackson and Cousins in Passing PAA in that span. He hasn’t been quite as hyper-efficient as Jackson, but his 128.5 Independent Quarterback Rating since Week 3, and that’s with more attempts than all but one of the players with a similarly impressive rating (that darn Tom Brady…).
Conveniently enough, Herbert and Jackson face off in Baltimore in Week 6, so expect to see some fireworks.
Another thing to watch out for this week is the fight for the #1 spot. Patrick Mahomes has quickly lost his strangehold on the position after poor performances in two of his last four games, leaving him vulnerable to being supplanted this week (that darn Tom Brady…).
In case you are curious, here are the complete rankings through Week 5. We’re using Points Above Average per 60 snaps to give a sense for what each player’s weekly average is; in essence, the number of points he contributes above an average QB in each start.
| Player | PAA/60 | Rk | Last | Start of Season |
| Patrick Mahomes | 6.65 | 1 | 1 | 2 |
| Tom Brady | 6.60 | 2 | 2 | 3 |
| Aaron Rodgers | 5.30 | 3 | 3 | 1 |
| Kirk Cousins | 4.63 | 4 | 4 | 9 |
| Lamar Jackson | 4.57 | 5 | 6 | 12 |
| Justin Herbert | 4.06 | 6 | 8 | 10 |
| Josh Allen | 3.75 | 7 | 9 | 6 |
| Deshaun Watson | 3.28 | 8 | 5 | 4 |
| Matthew Stafford | 3.20 | 9 | 10 | 14 |
| Russell Wilson | 2.96 | 10 | 7 | 5 |
| Kyler Murray | 2.45 | 11 | 12 | 15 |
| Derek Carr | 2.33 | 12 | 11 | 7 |
| Teddy Bridgewater | 1.67 | 13 | 13 | 18 |
| Dak Prescott | 0.71 | 14 | 14 | 17 |
| Ryan Tannehill | 0.46 | 15 | 15 | 8 |
| Matt Ryan | 0.39 | 16 | 16 | 11 |
| Baker Mayfield | -0.47 | 17 | 17 | 13 |
| Jacoby Brissett | -0.85 | 18 | 24 | 21 |
| Ryan Fitzpatrick | -0.94 | 19 | 18 | 16 |
| Jameis Winston | -0.99 | 20 | 22 | 55 |
| Tyrod Taylor | -1.00 | 21 | 19 | 56 |
| Joe Burrow | -1.19 | 22 | 21 | 22 |
| Taysom Hill | -1.22 | 23 | 20 | 20 |
| Mac Jones | -1.39 | 24 | 25 | N/A |
| Cam Newton | -1.45 | 25 | 23 | 19 |
| John Wolford | -2.15 | 26 | 27 | 24 |
| Daniel Jones | -2.19 | 27 | 28 | 71 |
| Jimmy Garoppolo | -2.21 | 28 | 29 | 25 |
| Jalen Hurts | -2.22 | 29 | 26 | 70 |
| Mason Rudolph | -2.34 | 30 | 30 | 26 |
| Marcus Mariota | -2.35 | 31 | 31 | 27 |
| Chad Henne | -2.38 | 32 | 32 | 29 |
| C.J. Beathard | -2.44 | 33 | 33 | 30 |
| Geno Smith | -2.49 | 34 | 41 | N/A |
| Jeff Driskel | -2.50 | 35 | 35 | 32 |
| Gardner Minshew | -2.51 | 36 | 36 | 33 |
| Kyle Allen | -2.56 | 37 | 37 | 35 |
| Tua Tagovailoa | -2.59 | 38 | 38 | 50 |
| Blaine Gabbert | -2.60 | 39 | 39 | 37 |
| Brett Hundley | -2.62 | 40 | 40 | 36 |
| Matt Schaub | -2.63 | 41 | 41 | 38 |
| Josh McCown | -2.63 | 42 | 42 | 39 |
| Chase Daniel | -2.67 | 43 | 43 | 40 |
| Nathan Peterman | -2.67 | 44 | 44 | 44 |
| Joe Webb | -2.67 | 45 | 45 | 42 |
| Joshua Dobbs | -2.67 | 46 | 46 | 43 |
| Blake Bortles | -2.68 | 47 | 47 | 45 |
| Sean Mannion | -2.68 | 48 | 48 | 46 |
| AJ McCarron | -2.72 | 49 | 49 | 48 |
| Matt Barkley | -2.72 | 50 | 50 | 49 |
| Colt McCoy | -2.73 | 51 | 51 | 51 |
| Nate Sudfeld | -2.80 | 52 | 52 | 52 |
| Garrett Gilbert | -2.80 | 53 | 53 | 54 |
| Tyler Huntley | -2.83 | 54 | 54 | 57 |
| Josh Rosen | -2.87 | 55 | 55 | 58 |
| Brian Hoyer | -2.89 | 56 | 56 | 59 |
| Case Keenum | -2.92 | 57 | 57 | 60 |
| Jared Goff | -2.93 | 58 | 34 | 31 |
| David Blough | -2.96 | 59 | 59 | 61 |
| Chris Streveler | -2.96 | 60 | 60 | 62 |
| Joe Flacco | -2.99 | 61 | 61 | 63 |
| Robert Griffin III | -3.08 | 62 | 62 | 64 |
| Drew Lock | -3.11 | 63 | 63 | 23 |
| Brett Rypien | -3.12 | 64 | 64 | 65 |
| Jarrett Stidham | -3.17 | 65 | 65 | 66 |
| Carson Wentz | -3.17 | 66 | 74 | 81 |
| Phillip Walker | -3.19 | 67 | 66 | 67 |
| Will Grier | -3.20 | 68 | 67 | 69 |
| Ben DiNucci | -3.22 | 69 | 68 | 68 |
| Nick Mullens | -3.35 | 70 | 69 | 72 |
| Alex Smith | -3.41 | 71 | 70 | 74 |
| Andy Dalton | -3.43 | 72 | 71 | 47 |
| Brandon Allen | -3.50 | 73 | 73 | 75 |
| Nick Foles | -3.68 | 74 | 75 | 76 |
| Mike Glennon | -3.68 | 75 | 72 | 73 |
| Ryan Finley | -3.70 | 76 | 76 | 77 |
| Trey Lance | -3.82 | 77 | 58 | N/A |
| Dwayne Haskins | -3.98 | 78 | 77 | 78 |
| Zach Wilson | -4.16 | 79 | 78 | N/A |
| Jake Luton | -4.19 | 80 | 80 | 79 |
| Mitchell Trubisky | -4.47 | 81 | 82 | 80 |
| Davis Mills | -5.30 | 82 | 86 | N/A |
| Trevor Lawrence | -5.36 | 83 | 84 | N/A |
| Sam Darnold | -5.39 | 84 | 81 | 82 |
| Justin Fields | -5.81 | 85 | 85 | N/A |
| Ben Roethlisberger | -6.07 | 86 | 83 | 53 |
| Taylor Heinicke | -6.13 | 87 | 79 | 28 |
By Steven Schwarz
Here are 3 prop bet options that jibe with what we can find on SIS Bets.
*Odds courtesy of DraftKings
1) Chris Godwin, 5.5 receptions, under -110
The Tampa Bay offense has been dominated by their air attack, but it’s pretty diverse with dangerous options everywhere even with tight end Rob Gronkowski sidelined. Godwin gets his fair share, but Mike Evans, Antonio Brown, Cameron Brate and Giovani Bernard have kept Godwin from exploding for most of the season.
We see that trend continuing and SIS data has Godwin seeing just 6.2 targets for which he’ll catch 4.5 receptions for 56.8 yards. Based on that data a fair market value for the under would be -237, but DraftKings has placed the odds at -110.
2) Giovani Bernard, 1.5 receptions, over -150.
Bernard has caught 15-of-17 targets this season. He’s grabbed at least two balls in all four games he’s played to date. That should continue in Week 6 as SIS analysis expects Bernard to catch 2.7 of his 3.6 targets for 24.5 yards.
Fair market odds would put the true value at -302, but you’re only paying -150 at DraftKings.
3) Kenneth Gainwell, 3.5 receptions, under -135.
Gainwell continues to carve out a place in the Eagles’ offense and he’s done it primarily as a pass receiver out of the backfield, but he’s only caught more than three balls one time this season. He averages 2.8 receptions this season. Therefore, we like the under 3.5 receptions here. Fair market value should be -352 as we are projecting just 2.4 receptions for 24.9 yards.
Sports Info Solutions has been an innovator in the collection and analysis of sports data for almost two decades. SIS specializes in baseball and football data, using professional scouting practices to collect the most detailed and accurate information in both sports. Their data can be found in the majority of team front offices, and on websites such as Fangraphs and Football Outsiders.
By ALEX VIGDERMAN
Cowboys corner Trevon Diggs has been one of the most talked-about defensive players this season, starting with the opening game of the season in which he allowed one completion for 10 yards on four targets and picked off Tom Brady.
Since then, he’s followed that up with at least one interception in each game (with two in one of those games). That gives him twice as many interceptions (6) as anyone else in the NFL. He has the best total EPA on attempts as the primary defender in the league (-17 on 33 targets).
Despite all that, he’s not the leader among cornerbacks in Pass Coverage Points Saved.
Pass Coverage Points Saved Leaders, Cornerbacks, 2021
| Cov Snaps | Points Saved | |
| Marshon Lattimore | 174 | 24.8 |
| Trevon Diggs | 207 | 23.2 |
| Asante Samuel Jr. | 156 | 22.7 |
How is Diggs not the leader in Pass Coverage Total Points when he has six picks through five games?
To be honest, I would have expected him to lead because of that. Total Points gives defensive players credit for interceptions based on the EPA of the play, and interceptions are incredibly impactful from an EPA perspective. Diggs has accrued 23 Points Saved on those six plays alone.
Given that he only has 23 Pass Coverage Points Saved in total, that means that he has been roughly replacement-level on the plays where he doesn’t end up with the ball in his hands.
Given that he only has 23 Pass Coverage Points Saved in total, that means that he has been roughly replacement-level on the plays where he doesn’t end up with the ball in his hands.
Diggs is a bit hampered statistically by the fact that he’s covering top guys every week. He’s been targeted 33 times, third-most among cornerbacks in 2021. He has allowed a relatively high yards per coverage snap (1.4) because not only has he been targeted a lot, but receivers under his purview have been pretty successful overall (8.9 yards per target).
You could squint and see Jalen Ramsey of recent vintage—a quality defender who is put into spots that make it hard for him to maintain a good statistical profile. But it’s also a guy who has flashed every week with a big play that will outshine the rest of his performance.

That’s all well and good, but that doesn’t explain how a guy with many fewer interceptions (Lattimore) is able to jump him.
The biggest reason is that Lattimore has been targeted about as frequently as Diggs, but he has been much more successful in preventing completions overall. Lattimore’s Deserved Catch Rate—the percentage of catchable passes that the receiver either caught or dropped—is 48%, best in the NFL. As a part of that, he leads the league with nine passes defensed. Diggs, by way of comparison, sits at 76%.
Perhaps as relevant is that Total Points, as an EPA-based metric, gives players a lot of credit for performing on money downs. Lattimore has been targeted 12 times on 3rd and 4th downs so far, allowing just two completions and producing his one interception and eight of his nine defensed passes. At a team level, those 12 plays cost the offense 19 Expected Points.
I wouldn’t want to talk about the best cornerbacks of 2021 without also giving Asante Samuel Jr. some love, even if he’s a fairly convincing third place so far.
He’s been good on third and fourth down—but not as good as Lattimore.
He’s intercepted two passes—obviously much fewer than Diggs.
He’s allowed a Deserved Catch Rate of 82%, worse than either of the other two.
But what he has done very successfully is limit big plays against him. Of the 13 plays where any of these three has cost themselves at least one Point Saved, Samuel owns only two of them. He’s allowed three fewer yards after the catch per reception than Diggs with a comparable average depth of target (and if you’re worried, none of them has an outlier 70-YAC play skewing the average).
Samuel does have the lowest average depth of target against him of the three. Total Points accounts for that by evaluating the primary pass defender against the expectation of that play given factors like the throw location and coverage scheme. So he’s being judged relative to the job he’s being asked to perform.
The point of this isn’t to say that Diggs has had a bad season. Far from it. But just like referring to a quarterback’s TD:INT ratio only describes a small percentage of his throws, citing Diggs’ crazy interception numbers doesn’t tell the whole story, and other guys deserve to be discussed in the same breath as him through the first quarter-ish of the season.
by Henry Gise, 2021 Football Analytics Challenge Winner
Hog rate, as defined by Player Profiler, “captures the rate of passing game utilization [for an individual player] on a per-play basis by calculating the number of targets per snap.”
Hog Rate= Targets/Snaps
It can come into play when, say, a team has a group of tight ends whose individual contributions to the passing game differ heavily (e.g., a “blocking” tight end and a “receiving” tight end).
Thus, the defense might more easily predict where the ball is going based on tight end personnel.
My question is, can hog rate tell us where the ball is going based on player alignment?
For example, how did the frequency of slot targets change in 2020 when J.D. McKissic lined up there instead of any other player? How did McKissic’s target frequency change when he lined up in the slot rather than in the backfield or out wide?
Well, let’s see.
J.D. McKissic
| Position | Snaps | Hog Rate | Player Rate Elsewhere | Player Hog Rate Diff | Position
Hog Rate W/O Player |
Positional Diff |
| Backfield | 363 | 15% | 28% | -13% | 11% | +4% |
| Slot | 107 | 30% | 17% | +13% | 14% | +16% |
| WR | 62 | 27% | 19% | +9% | 12% | +15% |
We can see an increase in slot usage when McKissic lined up there, as indicated by the 30% hog rate he saw in the slot compared to the 14% rate the position saw otherwise. Likewise, when he lined up elsewhere, McKissic was targeted on just 17% of snaps.
So, two takeaways:
1) McKissic was far more likely to be targeted when positioned as a receiver (slot or wide).
2) The receiver position was far more likely to be targeted when McKissic lined up there.
I won’t pretend that this serves as some groundbreaking finding, as we commonly see this with backs who dominate the passing game.
It does, however, give a starting point from which we can look for less obvious phenomena, the most prolific of which occurs when Keenan Allen is the Chargers’ right-most wideout.
Take a look.
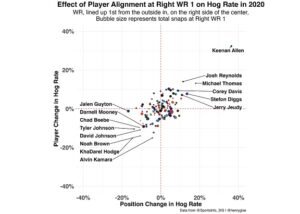
Allen saw a 36% increase when he lined up at right WR, and the position saw a 32% increase, decidedly the heaviest spread for any player anywhere in 2020. His 50% hog rate also blew everyone out of the water.
To clarify, Allen was thrown to on half of the 64 snaps he ran at right wideout, whereas every other Charger was targeted on only 14%. When LAC moved him wide right, they were very much trying to get him the ball.
If you’re curious as to whether or not it worked, he ranked 45th (in terms of EPA per target) out of 69 receivers with at least ten targets from right wideout. So, not really.
Let’s look at the rest of the leaders in positional hog rate differential.
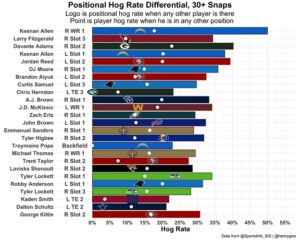
We can immediately see some noteworthy trends above, including the dominance of slots on this list. That’s primarily for two reasons:
Also, three different teams appear twice in the top eight. Perhaps some offenses work harder to get certain people the ball, or maybe these teams are unintentionally overly predictable with their targets. Likely, it’s a bit of both.
How can we know? We can look at the effects of hog rate differential on EPA/target.
Did teams successfully improve efficiency by targeting specific players in the right spots?
Or is excessive predictability hindering offensive production?
Let’s see how EPA per target per position changed when targeting a player with a more drastic increase in positional hog rate.
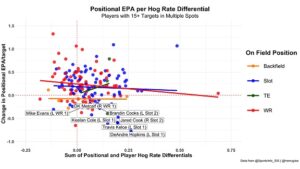
There’s a slight downward trend in all positions that aren’t TE (small sample size), implying that targeting those who get more targets-per-snap in that position does not work.
Is that right?
Travis Kelce, while having a much higher hog rate in left slot #1 than the rest of the Chiefs receivers, actually performs worse?
Yes, but –
His efficiency increased as he moved to left slot #1.
Let me explain.
Look at the differences in player-specific EPA/target rather than position-specific.
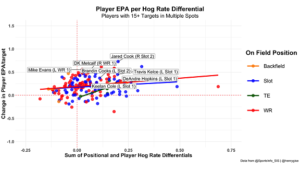
EPA for players tends to increase at the positions in which they’re getting more targets. Again, it’s only slight, but it seems to imply that when teams increase a player’s positional hog rate, his overall efficiency improves.
So, teams in 2020 heavily targeted players in positions wherein they were more effective, even if they may not have been the most effective player at that position.
This trend is likely to continue, especially with the pass-heaviness of today’s NFL and the aforementioned increase in slot usage over the past decade.
Offenses will continue to manipulate alignments to gain an edge, and, after all, every coach and quarterback wants to involve his best players.
by STEVEN SCHWARZ
Three prop bet options for Thursday Night Football that rate favorably per SISBets.com
*Odds courtesy of DraftKings
1) Russell Wilson, under 24.5 completions, -125.
This is the best prop bet on the board tonight. Wilson is averaging just 27.3 passing attempts per game, so the likelihood that he will complete 25 of them is minimal. Through four games he has yet to complete more than 23.
The SIS data predicts Wilson will throw 30 times and complete just 20 for 223 yards.
Based on this information, the actual odds for under 24.5 completions should be -475, but at DraftKings the number is set at -125. The math clearly favors this one.
2) Cooper Kupp, over 6.5 receptions, -145.
Through four games Kupp has been the hottest receiver in the league, producing 431 yards and five touchdowns on 42 targets and 30 receptions. He’s gotten double-digit targets in every game and only once has Kupp caught fewer than seven balls.
The Seahawks’ pass defense hasn’t been very good, yielding the seventh-most completions, fifth-most yards and eighth-most touchdown passes. Kupp and Stafford should be a potent weapon.
Our analysis predicts Kupp will see 12.5 targets, catch 8.9 balls for 102.9 yards. A fair number for the Kupp over should be -363, but we only have to give -145.
3) Robert Woods, under 5.5 receptions, -135.
Woods has been a disappointment this season and through the first four games has yet to catch six balls in a game.
The primary reason is opportunity.
Last season he averaged 8.1 targets, but through for games this season he’s getting only 6.3 targets.
The SIS prediction analysis says he will see 5.6 targets, catch 3.8 balls for 42.5 yards.
If correct, a fair number for the under would be -442, yet at DraftKings the number is set at -135.
SIS has been an innovator in the collection and analysis of sports data for almost two decades. SIS specializes in baseball and football data, using professional scouting practices to collect the most detailed and accurate information in both sports. Their data can be found in the majority of team front offices, and on websites such as Fangraphs and Football Outsiders.
Odds –
Quarterback Passing Yards
————————————
Matthew Stafford, over 298.5, -115/under -115
Russell Wilson, over 266.5, -115/under -115
Quarterback Passing TDs
———————————–
Matthew Stafford, over 2.5, TDs, +130/under -175
Russell Wilson, over 1.5 TDs, -155/under +115
Quarterback Interceptions
———————————-
Matthew Stafford, over 0.5, INTs, +110/under -145
Russell Wilson, over 0.5 INTs, +130/under -175
Quarterback Completions
———————————-
Matthew Stafford, over 25.5, completions, -110/under -125
Russell Wilson, over 24.5 completions, -105/under -125
Touchdown Scorers
Los Angeles Rams –
Cooper Kupp, -130
Darrell Henderson Jr., -110
Robert Woods, +110
Van Jefferson, +200
Tyler Higbee, +200
Sony Michel, +230
DeSean Jackson, +300
Matthew Stafford, +550
Seattle –
Chris Carson, -110
Tyler Lockett, +100
DK Metcalf, +105
Alex Collins, +200
Freddie Swaim, +200
Russell Wilson, +300
Gerald Everett, +350
Will Dissly, +400
Travis Homer, +450
DeeJay Dallas, +450
Rushing Yards
——————-
Los Angeles –
Darrell Henderson Jr., 64.5, over -115/under -115
Matthew Stafford, 5.5, over -110/under -120
Seattle –
Chris Carson, 46.5, over -110/under -120
Russell Wilson, 21.5, over -110/under -120
Receiving Yards
———————
Los Angeles –
Cooper Kupp, 84.5, over -115/under -115
Darrell Henderson Jr., 20.5, over -115/under -115
Robert Woods, 60.5, over -115/under -115
Tyler Higbee, 42.5, over -115/under -115
Van Jefferson, 44.5, over -110/under -120
Seattle –
Chris Carson, 9.5, over -115/under -115
DK Metcalf, 73.5, over -115/under -115
Freddie Swaim, 21.5, over -110/under -120
Tyler Lockett, 67.5, over -115/under -115
Receptions
————–
Los Angeles –
Cooper Kupp, 6.5, over -145/under +110
Darrell Henderson Jr., 2.5, over -180/under +135
Robert Woods, 5.5, over +100/under -135
Tyler Higbee, 3.5, over -125/under -105
Van Jefferson, 3.5, over -110/under -120
Seattle –
Chris Carson, 1.5, over -140/under +105
DK Metcalf, 5.5, over -150/under +115
Freddie Swaim, 2.5, over +145/under -195
Tyler Lockett, 5.5, over +100/under -130
By JAMES RODRIGUEZ
Football has been as exciting as it always is. Marquee matchups in prime-time slots have gone down to the wire. We’ve been able to witness improbable field goal returns as well as hold our breath during record-breaking game winners like Justin Tucker’s. Unfortunately, injuries are another inevitable consequence of football.
They happen every year and as mentioned in the previous posts, the most nagging ones are those pesky hamstrings. These soft tissue injuries can be damning if not managed properly. The focus of this post will be to provide a gauge for the hamstring victims of Week 3.
I will be able to share professional insights into the rehab process and combine that with sourced reports to determine a level of concern.
Remember that the key to a successful return to play depends more on the management of the injury than the severity of it. With this in mind, let’s get to it!
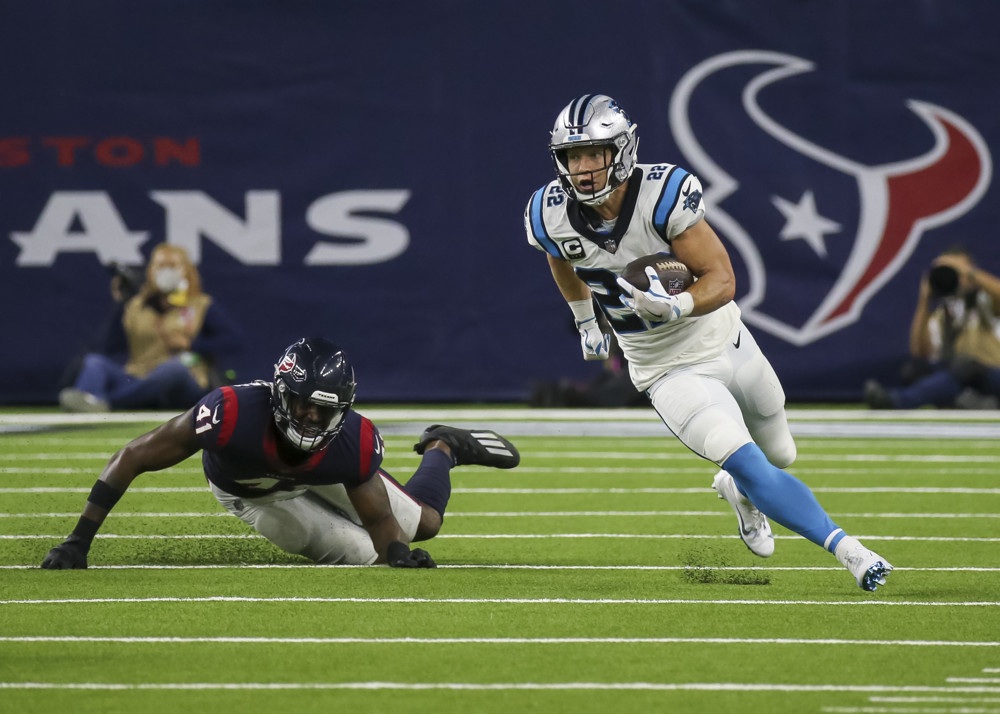
Christian McCaffrey pulled his left hamstring last Thursday night while breaking a run to the outside. He pulled up and immediately took himself out of the game. Fortunately, he did not return to action and received an MRI the next day to assess the damage.
Based on numerous factors, the Panthers have ruled him out for Week 4 but will not utilize an IR spot for him. One main point I’d like to add to these reports is that medical staffs should have enough information via assessment of imaging, bruising, palpation, tightness, and strength within three to five days to determine the recovery timeline.
I have been impressed with the management of McCaffrey’s injury and other positive signs I’ve observed such as his ability to walk without visible discomfort during the game. Clinical research suggests that an athlete that is unable to walk pain free within 24 hours may take on average 3 weeks longer to return to their sport than someone who can walk without pain.
I have been impressed with the management of McCaffrey’s injury and other positive signs I’ve observed such as his ability to walk without visible discomfort during the game.
It will be crucial to monitor McCaffrey’s practice participation next week. I believe there is a chance he can return Week 5 based on his response and progression through rehab, though he will remain as a risk for a re-injury. My preference would be a Week 6 return to give his tissues greater time to regenerate and mature.
AJ Brown’s hamstring situation is harder to determine based on the difficulty identifying when the actual injury occurred. From my film review, it appears he makes a subtle reach for his left hamstring after the first play where he was targeted on a WR screen.
He played an additional eight plays with four of them involving high-velocity running. These articles I’ve written establish high-velocity running as a concern. Sprinting increases the length and tension force on a muscle. Exposing a susceptible muscle to that is not ideal. Hopefully he injured his hamstring on his last play and not that first one I mentioned.
There has been no confirmation of an MRI to assess the damage, and initial reports have speculated that he is considered week-to-week. Brown is yet to practice this week and has not been officially ruled out for Week 4. I do not expect him to play the next 2 weeks, and I would be concerned if he did.
Beyond that timeframe, we will be at the mercy of practice reports to provide any clarity on the situation. I hope Julio Jones can provide some insights from his experience last year and we can get a healthy Brown to marvel at once he returns.
Quick hitters on other notable hamstring injuries
Sterling Shepard strained his right hamstring making an out cut toward his left in which he planted on his right leg. He immediately reached for the back of his leg and went to the sideline. On the bench, he was able to extend his knee which puts a stretch on the affected muscle. That is an encouraging sign since an athlete with a severe injury would have difficulty doing that.
He has spent his practice sessions during the week working with the trainers along with his injured teammate, Darius Slayton, who also suffered a right hamstring strain. Their injuries are eerily similar.
Both players injured their hamstring while planting on their right leg to cut to the left (although, Slayton’s was on an in-breaking route). Both players escorted themself to the sideline and did not play another snap the remainder of the game.
The main difference between their injuries is where the players reached on the back of their thighs. Shepard’s reach appeared higher than Slayton’s and historically speaking, the higher the injury, the lengthier the recovery. I expect both players to be ruled out for Week 4.
Lastly, Marquez Valdes-Scantling pulled what appeared to be his left hamstring late during his last game. He did not return to play and had an MRI earlier this week. The team has reported that they do not believe this is a long-term issue based on the MRI result. He has not practiced this week and is trending toward being ruled out for Week 4.
I estimate that each of these players may return within a 3-to-5 week window based on the information at hand. They will be at risk to reaggravate their injury during that time, but I hope that they are managed appropriately to have a successful season.
This three-week muscle piece has hopefully shared some insights into the dynamics of muscle injuries. I compare it to a short school session where I provided you with an introduction, shared a comparison between injuries, and ended it off with some case studies.
Hamstring injuries can be highly challenging to evaluate. As with most of the things that our company studies, details matter. Hope you can put the education and knowledge to good use.