BY ALEX VIGDERMAN
The SIS DataHub Pro has put in some work in the offseason. And that work isn’t done.
First, a quick bit of background.
We have two portals for people to interact with our treasure trove of football data.
One is the SIS DataHub, which is a great resource for dozens of statistics at the NFL level, including our proprietary total-value statistic, Total Points. That site is available to everyone free of charge.
The other is the SIS DataHub Pro, which has a price tag but adds in the ability to sort, filter, and download data in whatever configuration you like, and also includes college football data. You can sign up for a demo here.
This week, we are publishing updates to the DataHub Pro that seriously beefs up what it offers you as an analyst, especially on the college side. With the draft coming this week, it’s the perfect time to check out the DataHub Pro.
Consistent Breadth and Depth Across Levels
Aside from the fact that we’re adding dozens of new items to the site, we also made it a point to keep the available stats and filters consistent regardless of what you’re looking for. That means that you’ll find the same filters and statistics available on each of the NFL, CFB, player, and team leaderboards.
So if you find that, for example, the Patriots were very poor when they used zone blocking against a light box in 2020, you can use the same filters to find a possible addition in the draft that might suit that deficiency (might I suggest Western Michigan tackle Jaylon Moore?).
Major Overhaul to College Leaderboards
Because we didn’t have quite as much available on the college side previously, you instantly feel the impact of these updates when you run your first query.
Here’s an example. The DataHub Pro’s Receiving leaderboard for college players already had 18 statistics and 32 filters for you to slice and dice data on pass-catching prospects.
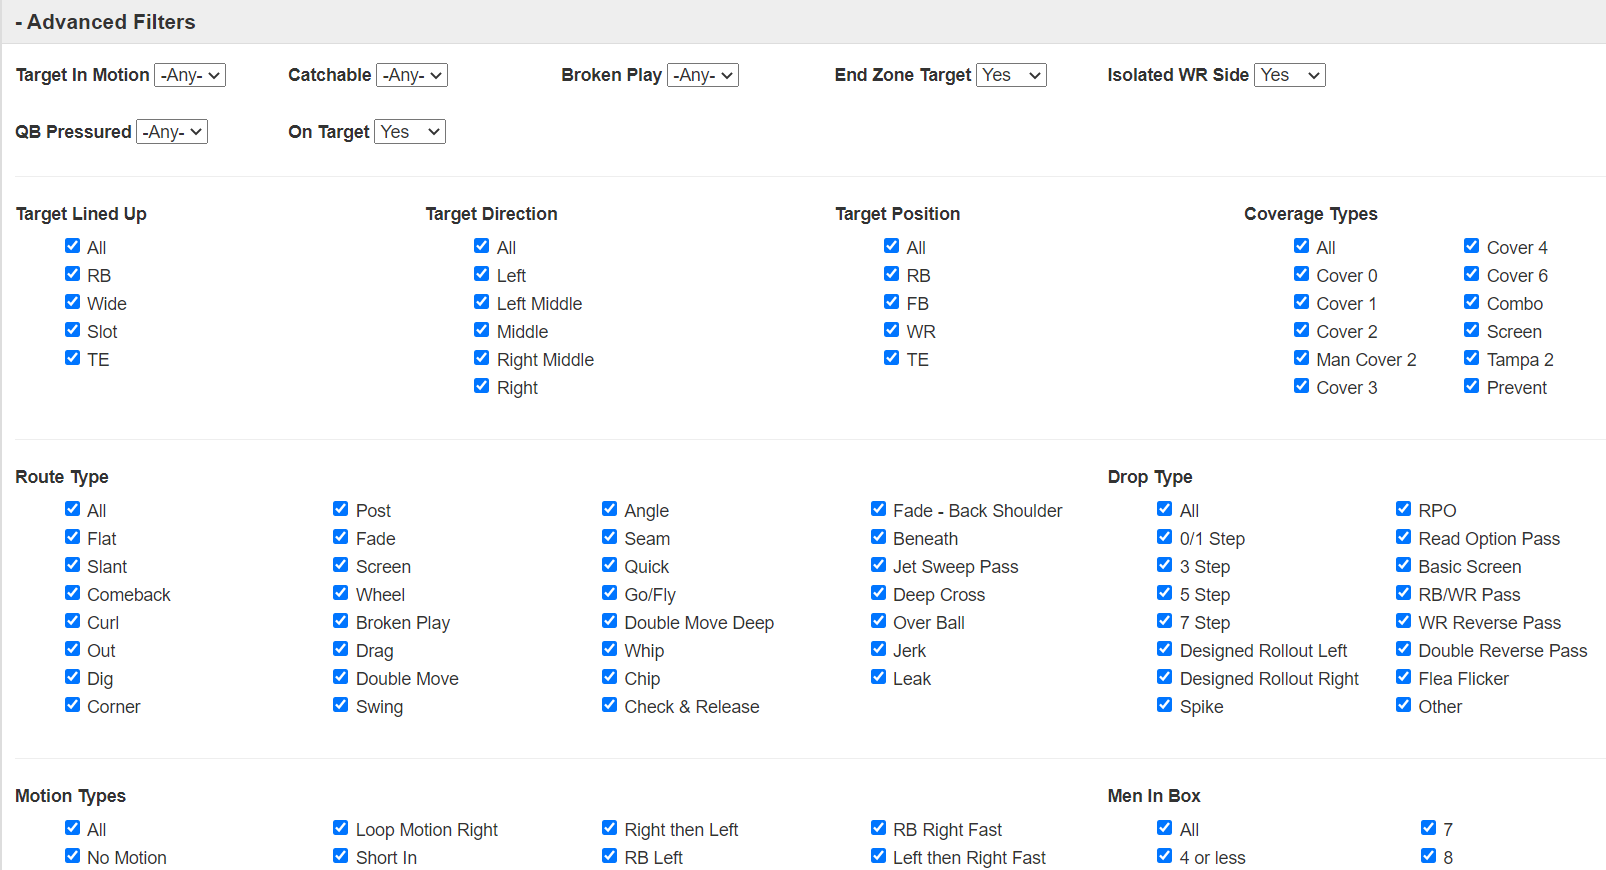
Now, we’re offering 37 statistics and 43 filters. Here’s a slice of that.

You could already find out that another Western Michigan product, receiver D’Wayne Eskridge, led the nation in yards per catchable target when lined up out wide against man coverage in 2020.
Highest Yards per Target on Catchable Throws Lined up Wide Against Man Coverage, 2020 (min. 10 tgt)
| Player | Team | Tgts | Y/Tgt | ADoT |
|---|---|---|---|---|
| D’Wayne Eskridge | Western Michigan | 13 | 21 | 9.4 |
| Cornell Powell | Clemson | 18 | 18.6 | 13.6 |
| Erik Ezukanma | Texas Tech | 14 | 18.1 | 13.5 |
| Dax Milne | BYU | 13 | 17.3 | 16.2 |
| DeVonta Smith | Alabama | 18 | 16.8 | 12.3 |
Now you can truly go as deep with your analysis as you can anywhere on the Internet. We can now also find out who saw the most on-target throws into the end zone when they were isolated on their side of the formation. That was SIS’s 38th-ranked receiver headed into the draft, Jonathan Adams Jr. of Arkansas State, who had nine such targets and led the nation with 1.3 EPA per target on such throws.
Like we have for the NFL side, statistics are now split into three tabs: one for Totals, one for Rates, and one for Value statistics.
That last category is really exciting, because this release of the SIS DataHub Pro now offers the ability to explore EPA-based stats at the college level. That starts with Expected Points Added itself but moves on to things like Positive Play %, Boom% / Bust% (the percent of plays with an EPA above 1 or below -1), and of course our flagship metric Total Points. This was available for draft-eligible players via the SIS Football Rookie Handbook, but now you can pair it with the filtering functionality that the DataHub Pro provides.
Most Points Saved per Play in 2020, Man Coverage Snaps Lined Up Outside (min. 10 targets)
| Player | Team | Cov. Snaps | Positive% | Points Saved / Play |
|---|---|---|---|---|
| Deommodore Lenoir | Oregon | 64 | 36% | 0.24 |
| Jaylon Jones | Georgia State | 61 | 13% | 0.23 |
| Caelen Carson | Wake Forest | 78 | 28% | 0.22 |
| Coney Durr | Minnesota | 41 | 50% | 0.22 |
| Kenderick Marbles | Louisiana-Monroe | 46 | 31% | 0.21 |
| Lenoir, SIS’s 30th-ranked CB entering the draft, was a man coverage asset in 2020 | ||||
What about the NFL?
It’s draft season, so we’re really excited about what we’re adding on the college side. But that doesn’t mean we’re shirking on our responsibilities in providing the best NFL charting data around.
Most of the filters that are new on the college side are also new on the NFL side. Here’s a sampling of the filters we’re excited about:
- Passing – What was the QB’s footing like at the snap?
- Rushing – Did the back use the designed gap?
- Receiving – Was the throw into the end zone?
- Blocking – How deep did the QB drop?
- Pass Defense – Was the QB pressured on the play?
- Pass Rush – What technique was the player lined up as?
- Run Defense – Was there motion on the play?
And beyond that, we still have plenty of stats up our sleeves for NFL analysts.

Here are the NFL leaders in Wins Above Replacement on plays with the clearest of clear running lanes: through the designed gap, no blown blocks, not contacted for at least 5 yards downfield. For conciseness, we’ll call these “clean runs.”
Most Wins Above Replacement on ÔÇ£Clean RunsÔÇØ, 2020
| Player | Att | WAR |
|---|---|---|
| J.K. Dobbins | 27 | 0.7 |
| Miles Sanders | 21 | 0.6 |
| Derrick Henry | 44 | 0.6 |
| Melvin Gordon | 29 | 0.5 |
| 6 tied | 0.4 | |
| Dobbins really capitalized on the opportunities afforded by his blocking and scheme in 2020 | ||
We’re ecstatic to finally get these updates out the door and into your hands, especially in advance of the NFL draft. Sign up for a free trial and take the new features for a spin! And if you have any feedback, we definitely want to hear from you. We have more updates in the pipeline for this offseason, but we want to make sure we’re doing well by our users first.