Sports Info Solutions
Author: Dominick Ricotta
-

The Transformation of Kodai Senga
By
How has the performance and usage of his pitches evolved from his time in Japan to now?
-
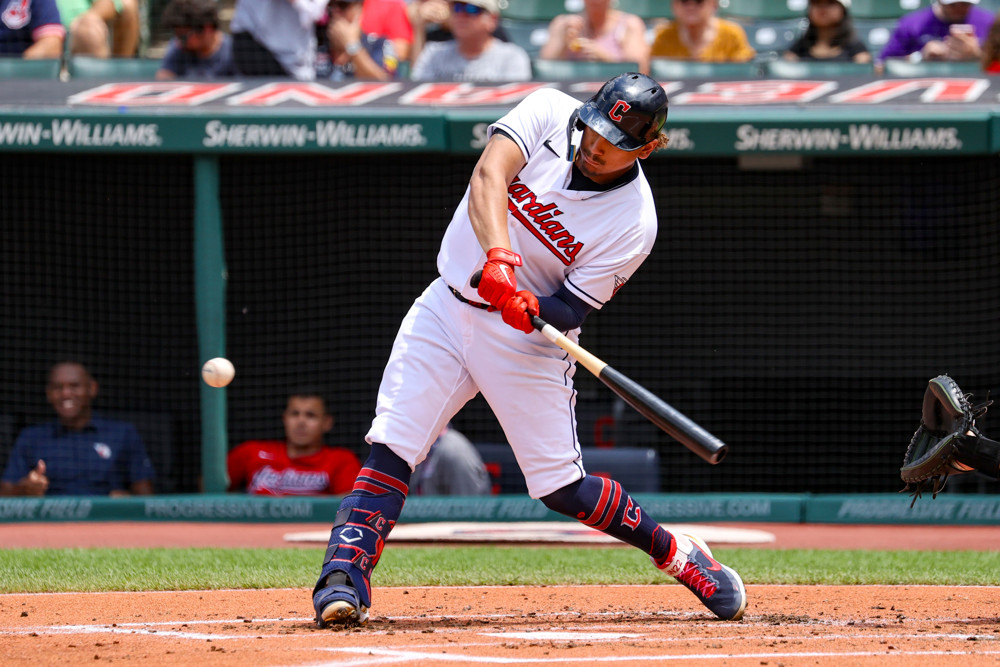
The Hottest of Hot Zones: Josh Naylor vs Low Pitches
By
A change in approach has worked and turned Naylor into a much more dynamic hitter
-

The Hottest of Hot Zones: J.D. Martinez vs High Pitches
By
Martinez has evolved as a hitter into one who can handle the pitch up top.
-
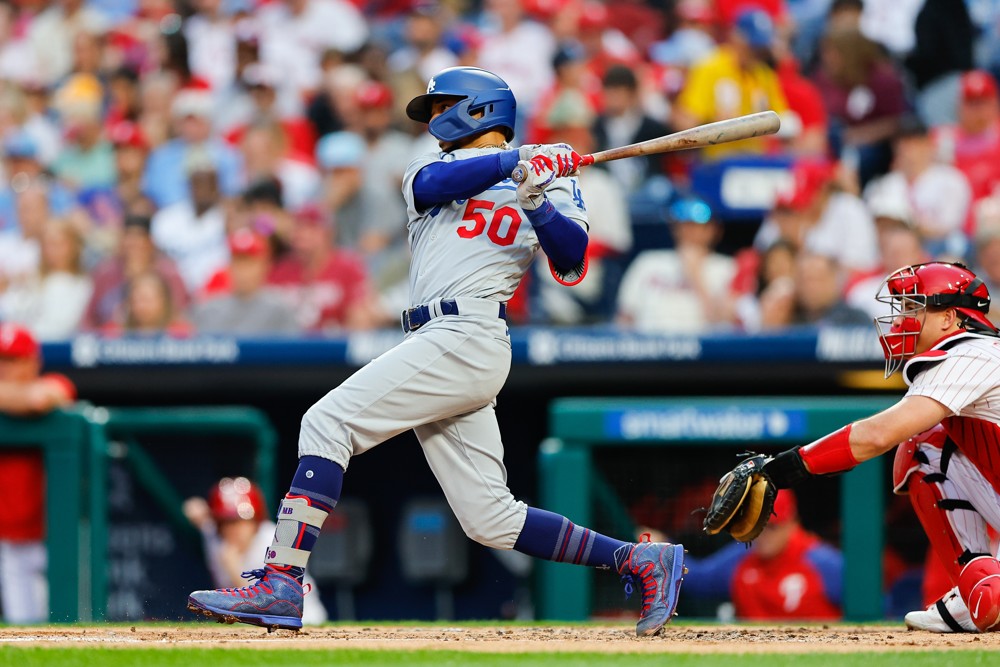
The Hottest of Hot Zones: Mookie Betts vs Inside Pitches
By
On how Betts attacks pitches like a golfer. We run through the elements that make Mookie one of the game’s best hitters.
-

The Hottest of Hot Zones: Corbin Carroll vs Outside Pitches
By
Carroll’s exceptional pitch recognition and willingness to hit the ball the other way make him so dangerous
-

Alek Manoah’s Mechanics: Perhaps a Little Off?
By
One of our scouting analysts found three little differences between 2023 and 2022.
-

Reviewing Candidates For The New-Look Shift
By
Nine players who could get the Joey Gallo treatment (including Gallo himself). But should they?
-

Josh Hader Has Found Deception Again
By
The Padres got Hader back to basics and it seems his mechanics are back on track.
-
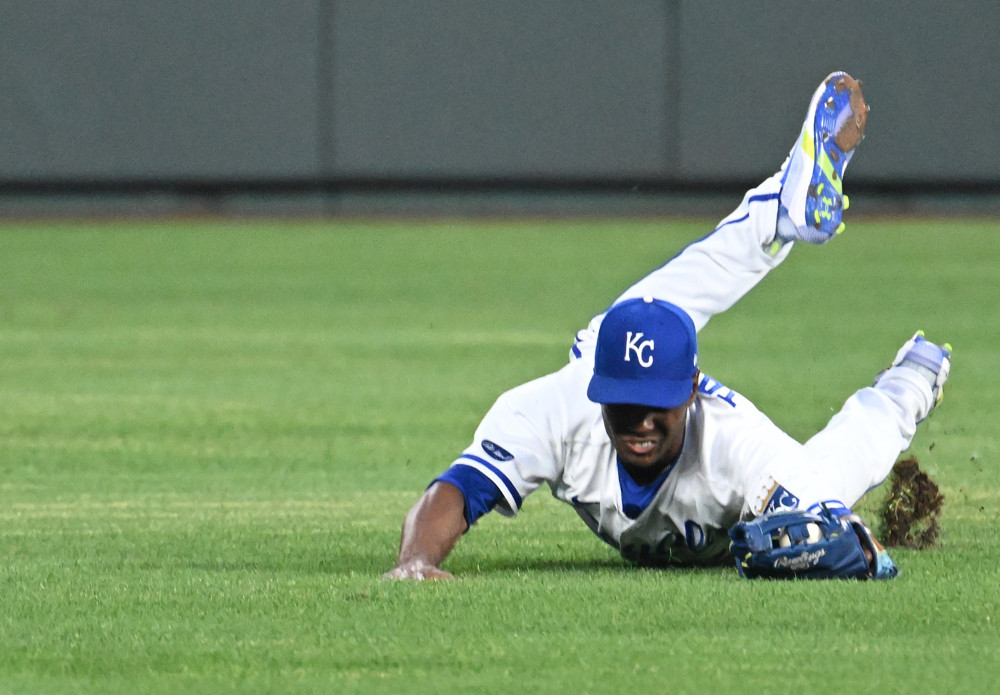
Playing The Field: Targeting Defensive Improvements At The Trade Deadline
By
You can’t just be thinking about bats and arms at the trade deadline. Finding a good glove can be valuable too.
-

What’s going on with Josh Hader?
By
We’ve picked up on a release point change that may be making him easier to hit.