Sports Info Solutions
Category: Baseball
-

Get to know our VP of Baseball, Bobby Scales
By
Our new VP of Baseball, Bobby Scales, shares his background, why he came to SIS, and his favorite MLB moments!
-
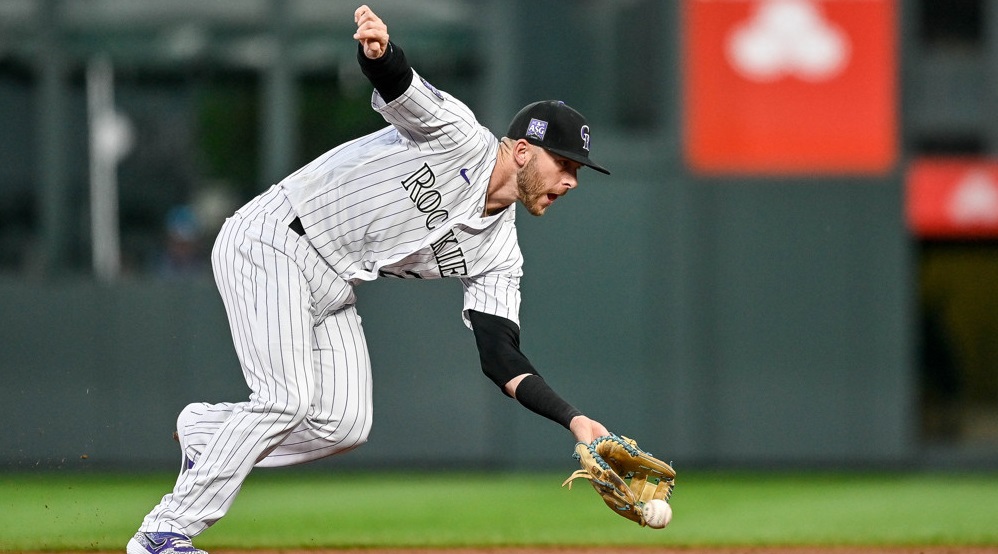
Stat of the Week: Trevor Story’s New Homes
By
The former Rockies shortstop has a new position and a new team.
-

Sports Info Solutions Announces Partnership With Northwoods League
By
SIS named the exclusive Official Data Provider of the Northwoods League
-

The Defensive Excellence of Matt Chapman & Matt Olson
By
The Blue Jays and Braves are adding the standard-setters at their respective positions.
-

-
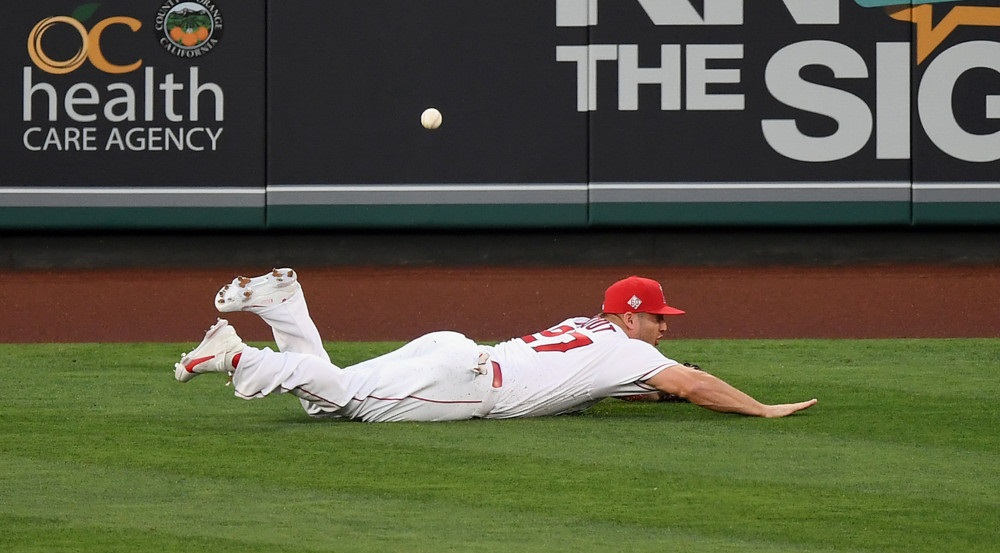
Why Move Mike Trout Off CF? Let’s Look at the Numbers
By
Trout doesn’t rate well in a couple of important areas.
-

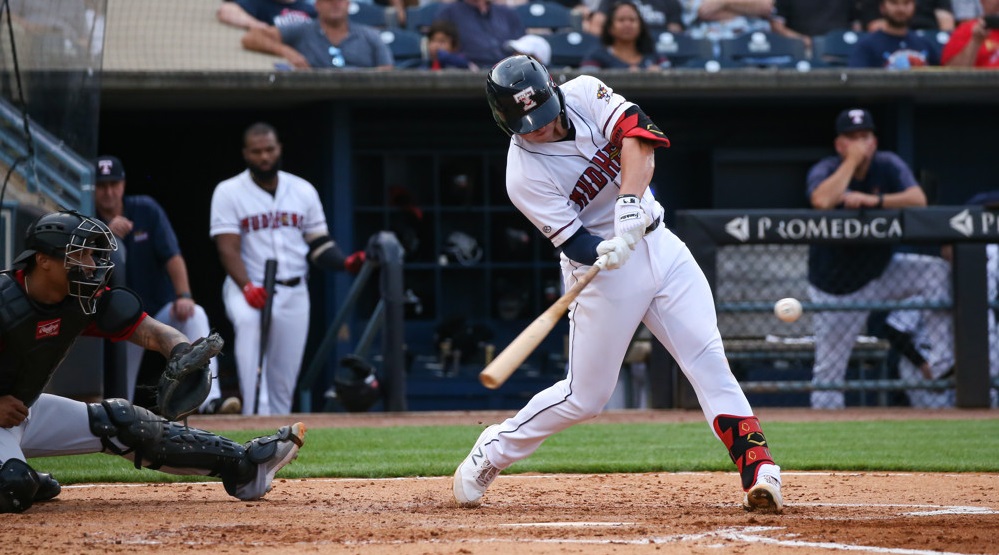
2021’s Top Minor League Bat Missers
By
Aaron Ashby was among the most effective in the minors. But he’s not the only standout among prospects.
-
Putting (Synthetic) Statcast Numbers on Top Minor League Sluggers
By
We can replicate Statcast data for minor league hitters. Here are some numbers on top prospects like Adley Rutschman and Spencer Torkelson.
-
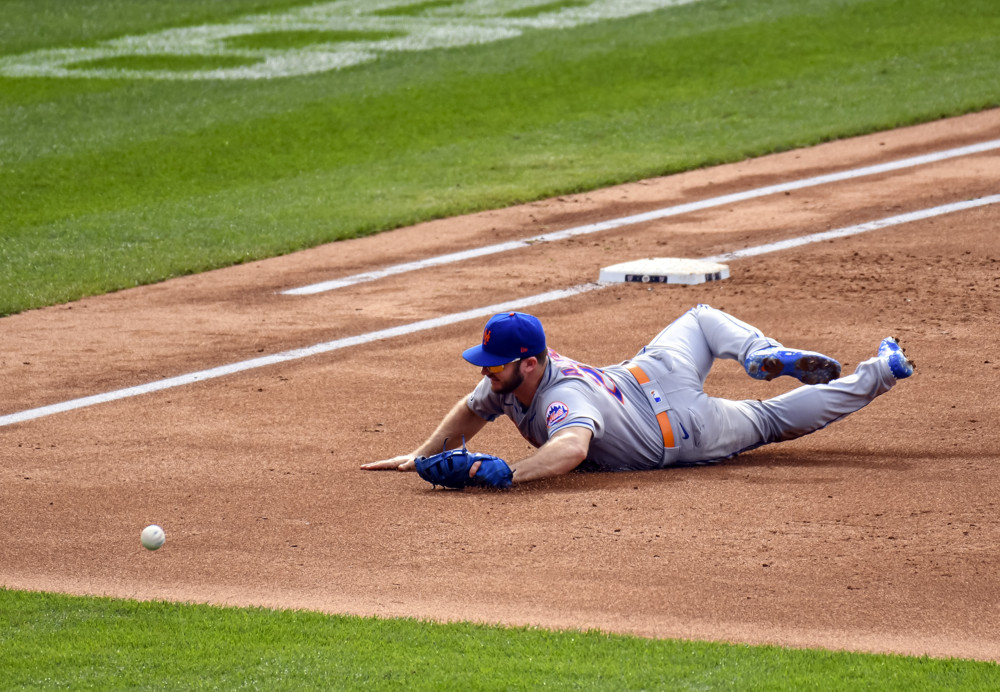
DH’ing Pete Alonso May Help Save Him From Himself
By
Pete Alonso does something way more than any other first baseman … and it might hurt him at some point.
-

New baseball podcast: Working in MLB Ops w/ Josh Ruffin & Jasmine Dunston
By
We’re joined by Josh Ruffin of the Twins R&D group and White Sox director of minor league operations Jasmine Dunston.