Sports Info Solutions
Category: Baseball
-
How much has Kyle Schwarber improved on defense?
By
BY MARK SIMON Kyle Schwarber had a rough re-acclimation to left field for the Chicago Cubs last year. He finished 2017 costing his team 9 runs defensively, which ranked fourth-worst among all left fielders. But in 2018, after a rough Opening Day, he’s flipped the script. His 5 Defensive Runs Saved rank fourth best at…
-
When Pedroia returns: Much better than Núñez, but keep an eye on the sliding
By
BY NICK RABASCO This past offseason, the Red Sox re-signed infielder Eduardo Núñez with the knowledge that Dustin Pedroia would need a couple months to rehab his knee injury before getting back on the field. Nunez has been playing second base on a regular basis for Boston in 2018. Pedroia has been playing for the…
-
Why not shift José Altuve?
By
By ANDREW ZENNER I was looking through our data to determine whether there were any hitters that may be strong “shift candidates” that are shifted against infrequently. One name stood out in my findings: Houston Astros second baseman Jose Altuve. Let’s look at whether other elements of our data support the lack of shifting for…
-
Appreciating a .134-hitting catcher – for great defense
By
By LINDSAY ZECK Rockies catcher Tony Wolters is hitting .134 so far this season—third worst of all catchers with at least 50 plate appearances, ahead of only Alex Avila and Roberto Pérez. So why haven’t the Rockies sent him down to the minors and brought up the hot-hitting Tom Murphy from Albuquerque? Murphy is currently…
-
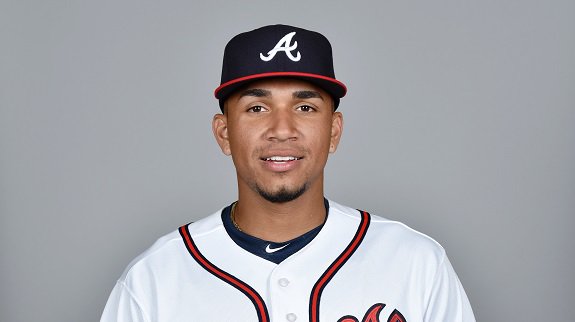
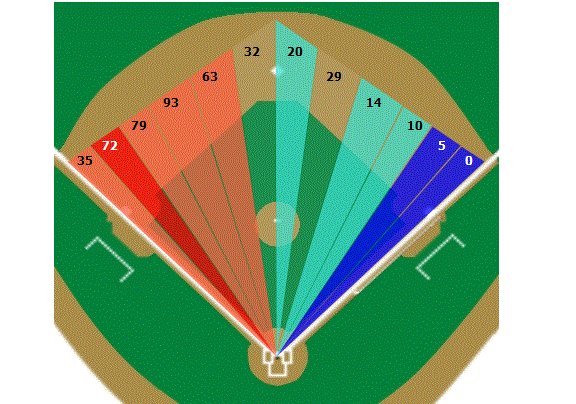
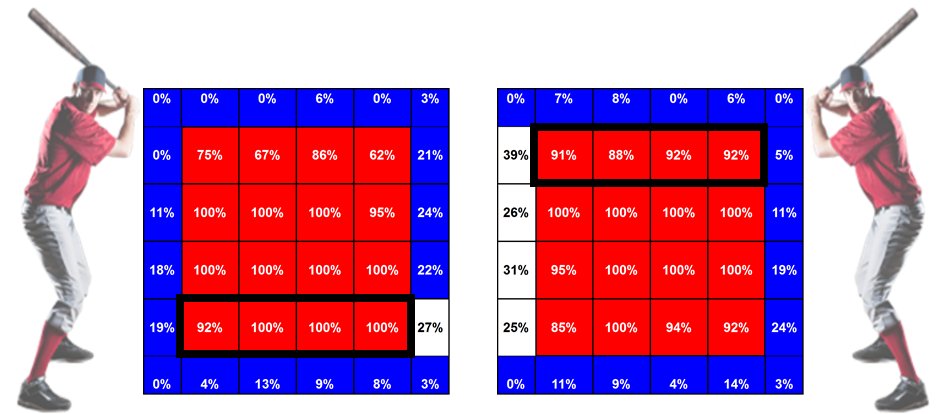
Johan Camargo’s improvements net him everyday role
By
By WILL HOEFER Braves’ Executive Vice President and General Manager Alex Anthopoulos called somewhat of a harried press conference on Sunday morning, in which he informed the media present at SunTrust Park that Jose Bautista had been released. The impetus for that decision, Anthopoulos noted, was to give Johan Camargo the everyday job at third…
-
Mike Trout, Albert Almora among outfielders off to strong defensive starts
By
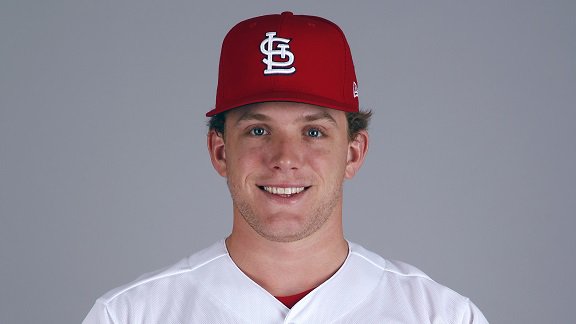
By LINDSAY ZECK On Monday, Mark Simon posted a blog entry about rookie Harrison Bader, who has had one of the most notable defensive performances thus far with diving catches like this one. He has already saved the Cardinals seven runs this season—tied for the third most in the league—despite only playing 152 innings. His…
-
How does Harrison Bader have so many Defensive Runs Saved?
By
BY MARK SIMON Most of the names atop the Defensive Runs Saved leaderboard are recognizable at this point of the season. One of the exceptions may be St. Louis Cardinals outfielder Harrison Bader. Bader has channeled his best Jim Edmonds in the form of multiple diving catches this season. He’s saved 7 runs defensively this…
-
Hardest-Hitting Minor Leaguers According to Synthetic Statcast
By
Statcast is a really exciting product to have at our fingertips when analyzing players. It has given the public a whole new vocabulary with which we can talk about baseball. How many times did you hear the terms “spin rate,” “exit velocity,” or “launch angle” before a couple years ago? Now these terms are everywhere.…
-
The numbers behind Sean Manaea’s hot start
By
BY SPENCER HARRISON Sean Manaea is the owner of MLB’s only no-hitter this season. He is also the owner of the league’s second-lowest ERA (1.03), trailing only Johnny Cueto (0.84). Manaea is far from a slouch, but his current statline places him in company that most would consider aces. Sports Info Solutions charts every pitch…
-
With Byron Buxton out again, let’s find his most statistically similar player
By
BY ALEX VIGDERMAN While on a rehab assignment for another injury this past weekend, Byron Buxton fouled a ball off his toe and suffered a hairline fracture, sidelining him again in what is quickly shaping up to be a lost season. We all love keeping track of the trials and tribulations of Buxton as a…