Sports Info Solutions
Category: MLB
-
Alex Gordon had a great defensive week
By
By MARK SIMON The 22-49 Kansas City Royals don’t have much to be happy about these days, but the defensive play of Alex Gordon provided at least one positive this weekend. Gordon had four Good Fielding Plays in the three-game series against the Astros this weekend (Good Fielding Plays are Web Gem-type plays and other…
-
‘O’ my: Orioles’ defense struggling mightily
By
BY MARK SIMON There was no reason to believe that the Baltimore Orioles were going to be as bad as they’ve been this season. Similarly, there was no reason to believe that the Orioles defense was going to be as bad as it has been in 2018. But here we are in mid-June, with the…
-
Stat of the Week: Evaluating the Phillies’ infield shifts
By
By ANDREW KYNE Jake Arrieta’s recent comments called attention to the Philadelphia Phillies’ infield shifts. The veteran right-hander complained that his team is “the worst in the league with shifts,” and by our Shift Runs Saved metric at Sports Info Solutions, he is indeed correct. The Phillies rank last in Major League Baseball in Shift…
-
Matthew Boyd turns back the clock
By
BY COREY FISHMAN In 2015, Matthew Boyd was acquired by the Detroit Tigers in a trade that ultimately sent David Price to the Toronto Blue Jays. That same season Boyd won the MiLB.com Fans’ Choice Award for best starting pitcher in the minor leagues and he was also selected to be a Double-A All Star…
-
Why does Brett Gardner lead outfielders in Defensive Runs Saved?
By
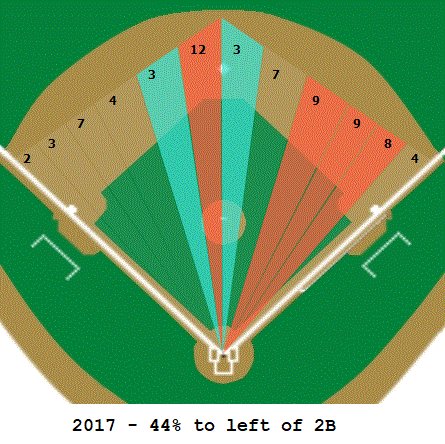
By MARK SIMON Age is no hindrance to 34-year-old New York Yankees outfielder Brett Gardner. He currently leads all outfielders with 14 Defensive Runs Saved this season, if you combine his work in center field and left field. This is nothing new for Gardner, who saved 20 runs defensively in 2017, his third season with…
-
Stat of the Week: Who’s moving up and down the Starting Pitcher rankings?
By
By Mark Simon From May 2013 through the end of the 2016 season, Clayton Kershaw almost always reigned supreme in The Bill James World’s Best Starting Pitcher Rankings, a measure based on the Game Score metric and a pitcher’s sustained excellence over a lengthy body of work. But Kershaw’s recent injury history has caused him…
-
Bryce Harper’s batting average vexed by infield shifts.
By
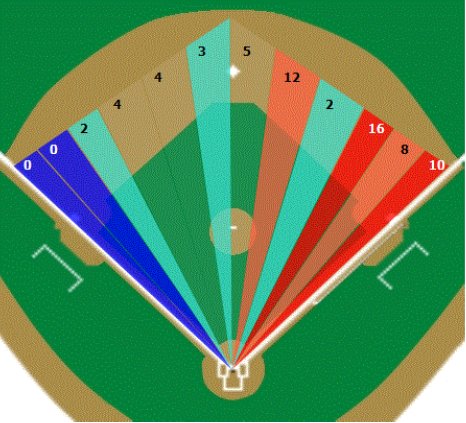
BY MARK SIMON Bryce Harper is having a very Bryce Harper-like season in a couple of regards. He has an NL-leading 18 home runs and 47 walks, to go with 40 RBI. So why is he hitting only .232? Some of that has to do with his performance against defensive shifts. Harper is seeing more…
-
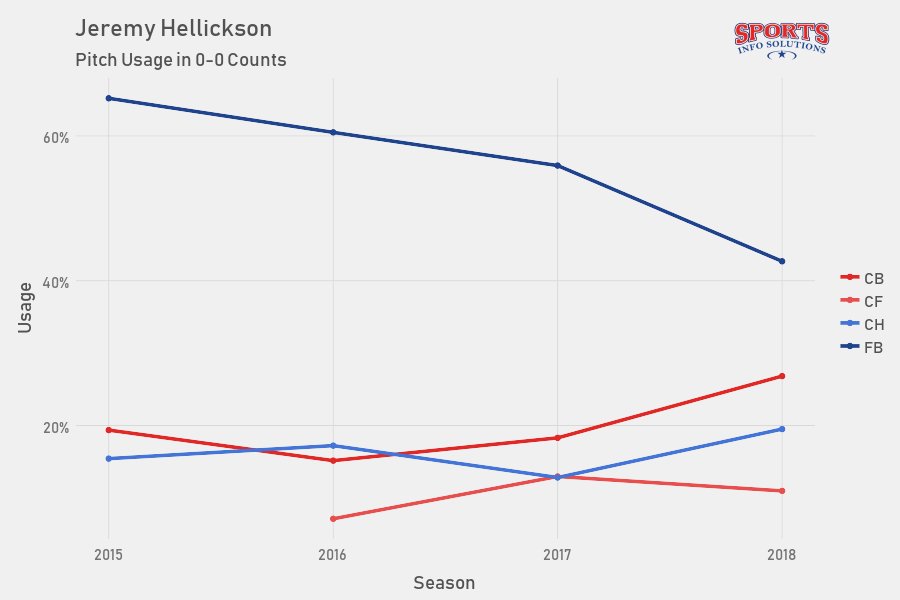
Jeremy Hellickson’s start keyed by curveball
By
BY SPENCER HARRISON Before Jeremy Hellickson made his 2010 debut with the Tampa Bay Rays, he was considered one of MLB’s most promising pitching prospects. Through his first two full seasons he looked every bit the part, stringing together consecutive seasons of 2.95 ERA and 3.10 ERA pitching in 2011 and 2012, albeit with some…
-
Kole Calhoun can’t beat the shift, but his glove is doing many good things
By
BY LINDSAY ZECK Angels right fielder Kole Calhoun has had one of the most unusual seasons of any player in 2018. His offensive performance has been well below his usual standards, but his defense is keeping him afloat. The hitting Of all the qualified batters in the game, Calhoun ranks last in batting average (.151)…
-
A closer look at the Mets catching situation
By
BY SEAN ZERILLO In 16 games with the New York Mets since being traded for Matt Harvey, Devin Mesoraco has provided a big power boost for his new club – hitting five homers with a .913 OPS over 50 at bats. He has channeled his 2014 All-Star form when he hit 25 doubles and 25…