Sports Info Solutions
Author: Andrew Kyne
-
Evaluating Infielder Throwing with the DRS PART System
By
Baseball Info Solutions recently introduced a major update to Defensive Runs Saved that will be rolling out this offseason. We’re splitting DRS for infielders into Positioning, Air, Range, and Throwing components. In that introductory blog post, we mostly covered how this will affect the Positioning and Range components (which were previously reported together as one…
-
Infield Defense in PARTs: A Major Update to Defensive Runs Saved Coming Soon
By
A major update to Defensive Runs Saved will provide a better understanding of infield defense.
-
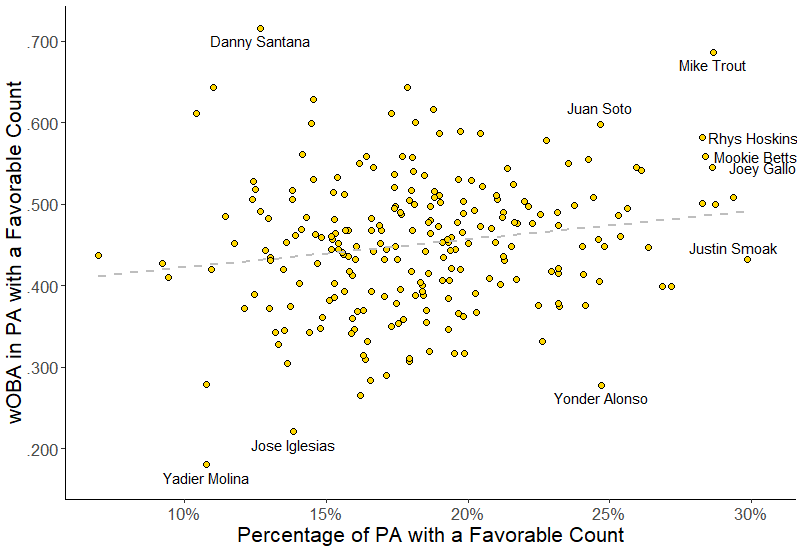
Which hitters reach favorable counts?
By
Which hitters get into favorable counts, like 2-0, 3-0, and 3-1? And which hitters then do damage?
-
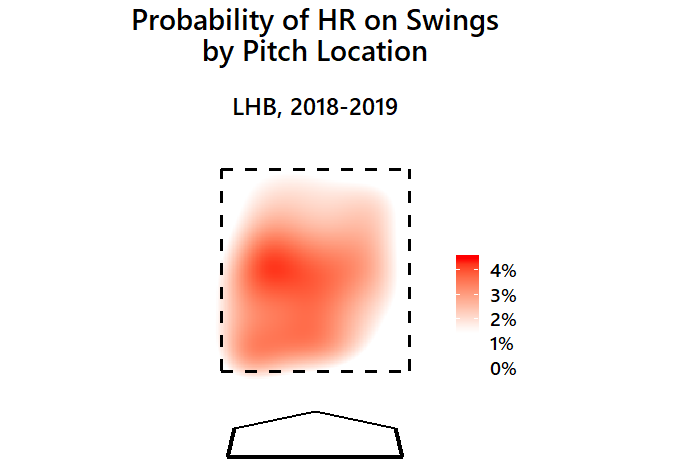
Visualizing Home Runs by Pitch Location
By
A look at which pitch locations generate home runs, and how it compares to several years ago when the home run wasn’t as common.
-
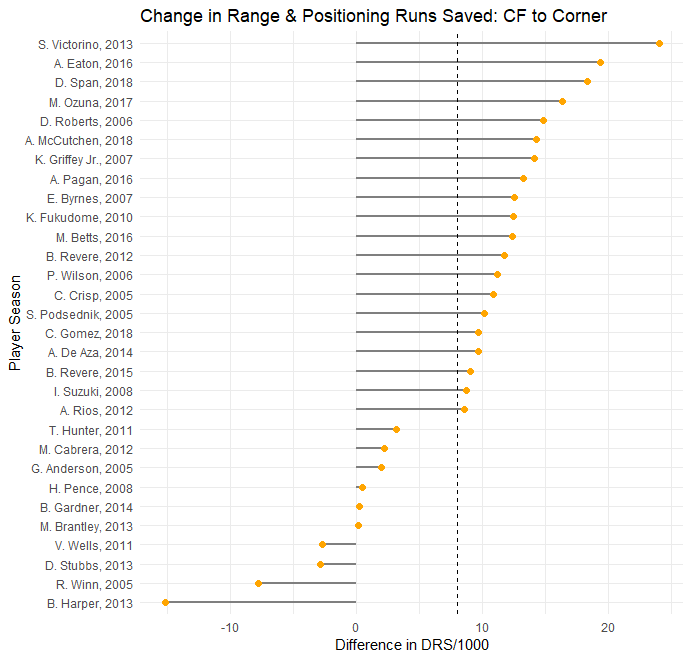
The Effect of Outfield Position Changes on DRS
By
How does DRS rate center fielders when they move to a corner? How do corner outfielders rate when they move to center?
-
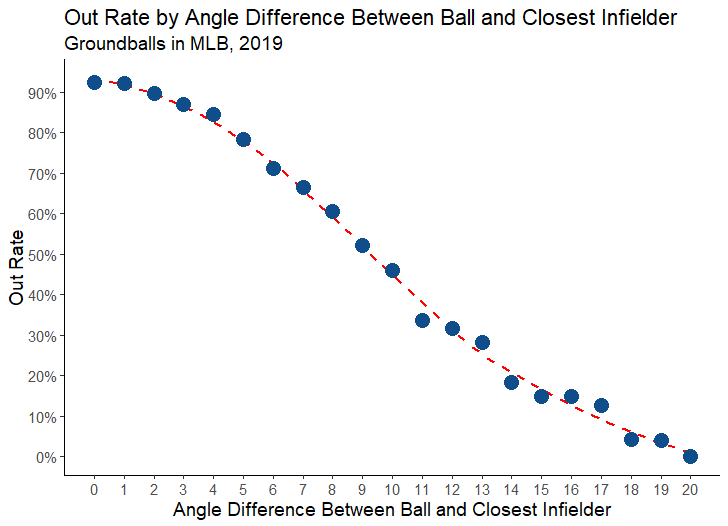
MLB’s Best Positioned Infields
By
Teams like the Astros, Rays, and Dodgers are aggressive in their positioning of infield defenders. Which teams have been best positioned in 2019?
-
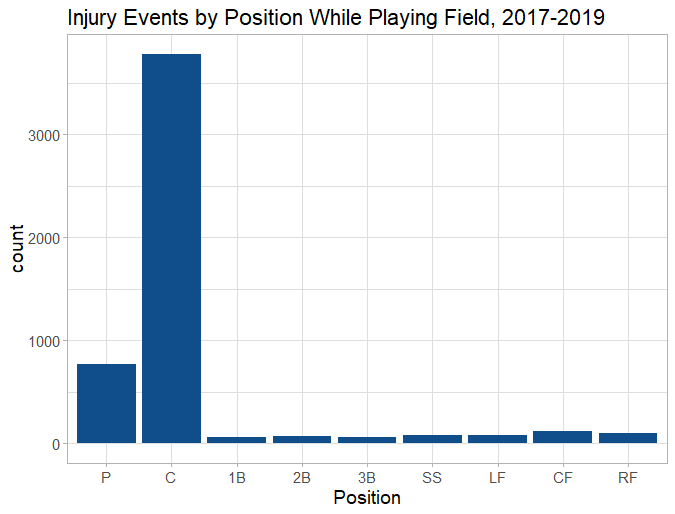
On Catcher Injury Risk and Managerial Decision-Making
By
Managers often avoid using backup catchers out of fear of injury. But how often do catchers actually get hurt?
-
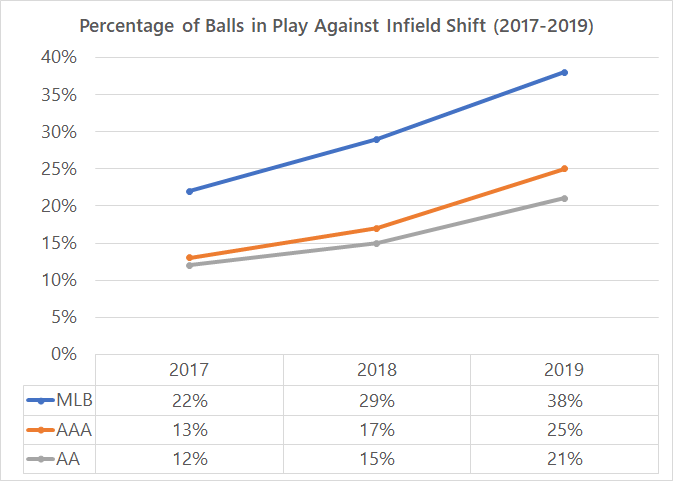
The Rise of Minor League Defensive Shifts
By
We talk a lot about shifts at the MLB level. What about in the minors? Are they rising like they are in the majors? Are they are as common?
-
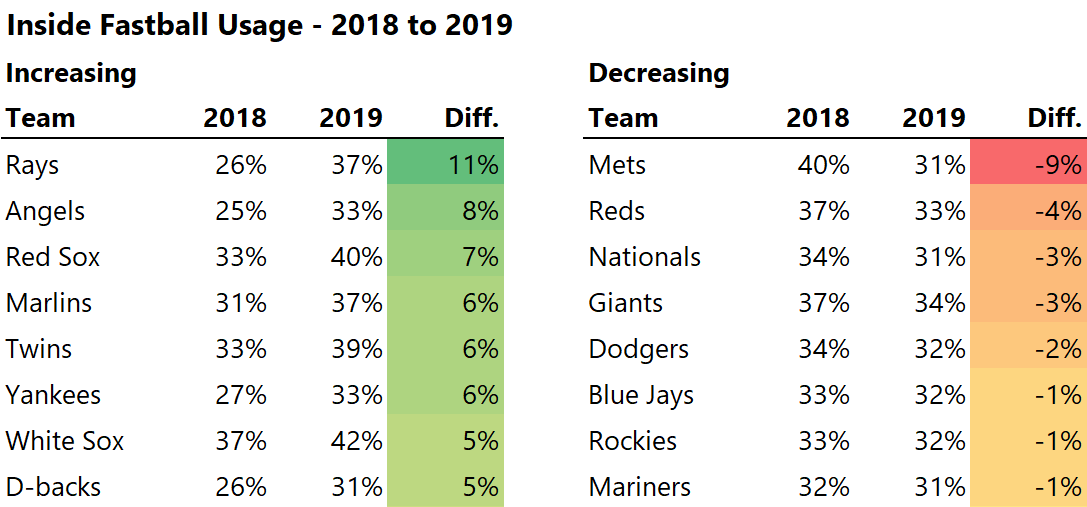
Mets moving away from the inside fastball
By
The Mets threw the highest percentage of inside fastballs in 2018. That hasn’t been the case in 2019.
-
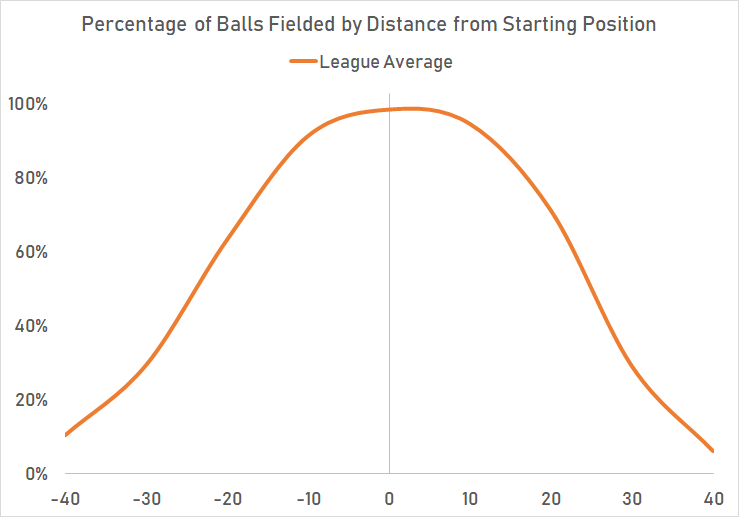
Visualizing Shortstop Range
By
A visual look at the lateral range of baseball’s best and worst shortstops.