Sports Info Solutions
Category: Baseball
-
Which players have been most affected by good and bad defensive plays?
By
We use Sports Info Solutions’ video-tracking to analyze which players have been robbed of the most hits and benefited most from errors.
-
Stat of the Week: MLB All-Stars vs. Total Runs Leaders
By
MLB All-Star Voting vs. Total Runs Leaders July 11, 2018 By MARK SIMON Who were the players most deserving of being All-Star starters in 2018? Let’s use Total Runs to put together a pair of teams based on numbers. Total Runs is a statistic created by Baseball Info Solutions that combines offense, defense, baserunning, and…
-
Keon Broxton has how many Defensive Runs Saved?!
By
By MARK SIMON Milwaukee Brewers center fielder Keon Broxton is in the midst of an all-time defensive stretch. Broxton has saved 11 runs defensively in nine games over 10 days since his recall from Triple-A. He’s tied for second in Defensive Runs Saved by a center fielder with none other than his teammate Lorenzo Cain,…
-
Stat of the Week: Who were June’s top defensive players?
By
The race for Defensive Player of the Month was a tight battle and, in the end, a pair of players tied for the top spot in our voting. So let’s salute Washington Nationals shortstop Trea Turner and Kansas City Royals left fielder Alex Gordon as June’s top defenders. Turner is one of the most improved defensive players in baseball. He…
-
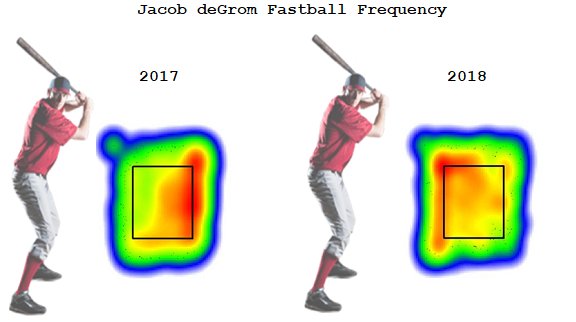
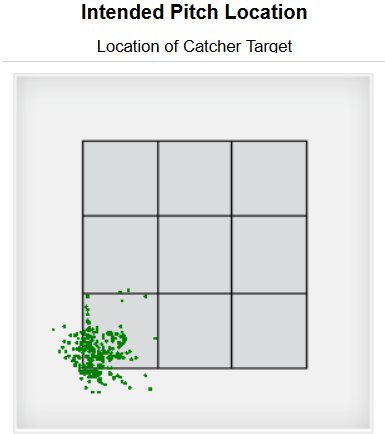
What helps make Jacob deGrom great?
By
Jacob deGrom has been an elite pitcher this season. And there’s much to know about his run of success.
-
Kyle Gibson’s slider has been vital to his success
By
By SEAN ZERILLO Minnesota Twins pitcher Kyle Gibson has had a breakout 2018 season, posting a 3.27 ERA with a 1.17 WHIP (career 4.55 ERA, 1.41 WHIP) over 14 starts and 82 2/3 innings pitched. Gibson has bumped his strikeout rate up to 8.8 strikeouts per 9 innings (K/9) from his career mark of 6.2…
-
Marco Gonzales seems to be figuring it out
By
By ANDREW ZENNER Before 2018, Marco Gonzales had never been able to experience sustained success in the major leagues. The former first-round pick had compiled a 5.47 ERA and 5.03 FIP in 77 1/3 innings from 2014 to 2017. That lack of success made it easier for the Cardinals to part ways with him when…
-
Numbers show improvement in Eric Hosmer’s range
By
by ANDREW KYNE Evaluation of San Diego Padres first baseman Eric Hosmer’s defense has long differed between the eye test and metrics such as our Defensive Runs Saved (DRS). Scouts and coaches have considered the Padres’ new first baseman to be among the league’s best at the position, while the numbers have typically rated him…
-
Alex Gordon had a great defensive week
By
By MARK SIMON The 22-49 Kansas City Royals don’t have much to be happy about these days, but the defensive play of Alex Gordon provided at least one positive this weekend. Gordon had four Good Fielding Plays in the three-game series against the Astros this weekend (Good Fielding Plays are Web Gem-type plays and other…
-
‘O’ my: Orioles’ defense struggling mightily
By
BY MARK SIMON There was no reason to believe that the Baltimore Orioles were going to be as bad as they’ve been this season. Similarly, there was no reason to believe that the Orioles defense was going to be as bad as it has been in 2018. But here we are in mid-June, with the…