Category: NFL

  • Reviewing The 2019 NFL Draft Class

    Reviewing The 2019 NFL Draft Class

    While many crave all the NFL Draft Team Grades that publications put out the day after the draft, including us on both accounts, there are many others who can’t stand it. Of course, we all have our own NFL Draft prospect rankings heading into that weekend, but those players have yet to play a single snap in the NFL. So, how can we really grade a team’s draft class if those players haven’t yet stepped onto the field?

    It usually takes at least three years to see how well a draft class turned out. While said publications, including us, don’t want to wait three years before putting out their grades on a draft class, we decided to now do both.

    Three years ago, prior to the 2019 NFL Draft, Sports Info Solutions created its first ever draft guide: The SIS Football Rookie Handbook. This book marked a first for SIS, as it was the first football publication since the company added the sport on the data collection front in 2015. After the 2019 NFL Draft, we, just as many others, posted our NFL Draft Team Grades, which can be seen here.

    I’ve developed a system to evaluate the draft classes using Total Points relative to position as the foundation. Now that three seasons have gone by, let’s use that to truly see how each team did with getting value from their selections in the 2019 NFL Draft.

    How much value did teams get?

    Before we get into the process, let’s take a look at how we ranked teams after the 2019 NFL Draft and then who got the most and least value. See the Appendix below to see how all 32 teams ranked in our 2019 rankings and in TP Score.

    Here are the teams we ranked at the top immediately following the draft back in 2019. To see our scouting grading scale, check out our new NFL Draft site.

    Top 5 Teams in 2019 Post-Draft Rankings
    Team Book Rank Grade
    Titans 1 6.63
    Bills 2 6.50
    Cardinals 3 6.46
    Ravens 4 6.44
    Bengals 5 6.44

    TP Score will be defined below, but here are the top 5 teams based on how much value they received from their draft class.

    Top 5 Teams in TP Score
    Team TP Rank TP Score
    Titans 1 84.64
    Broncos 2 82.81
    Raiders 3 77.23
    Buccaneers 4 67.50
    Jaguars 5 62.18

    The No. 1 team in 2019 (the time of our initial evaluation) and in this ranking both worked out to be the Tennessee Titans. Five of their six draft picks have been above average, all playing in at least 38 games over the past three seasons. The only pick who didn’t hit was D’Andre Walker, who appeared in only one game.

    The top 3 teams, the Titans, Broncos, and Raiders, are at the top for a reason. They drafted good players throughout their entire draft class. They were the only teams to draft above-average players on 75% or more of their draft class.

    Conversely, here are the bottom 5 teams from our 2019 rankings.

    Bottom 5 Teams in 2019 Post-Draft Rankings
    Team Book Rank Grade
    Saints 28 6.12
    Browns 29 6.10
    Seahawks 30 6.03
    Lions 31 6.00
    Chiefs 32 5.90

    Based on TP Score, here are the worst teams in terms of getting value from their 2019 draft picks.

    Bottom 5 Teams in TP Score
    Team TP Rank TP Score
    Chargers 28 16.00
    Panthers 29 14.53
    Bengals 30 12.48
    Eagles 31 12.24
    Seahawks 32 10.12

    Determining Total Points Score

    Now that you’ve seen the rankings, let’s explain the process. When looking back to see how good or bad a specific draft class was, there are two main points to detect:

    1. How productive were the draft picks on the field?
    2. How much talent did the team draft relative to the amount of picks they made? 

    As in: Did they hit on one player or did they hit on multiple players?

    To determine the value of the draft classes, I used Total Points, our flagship player value stat, from across the last three seasons. However, for those of you who are familiar with Total Points, it gives a lot of extra weight to quarterbacks. With that said, Kyler Murray, the No. 1 pick, alone would have had the 5th best draft class with his 286 Total Points if we just used raw Total Points.

    While there is a reason we weigh quarterbacks so much more compared to other positions (they are pretty important), using that raw number in this sense isn’t going to make for a perfect match. Yes, the Cardinals got a lot of value in Murray, but when looking at their draft class as a whole, I think many would agree they didn’t have the best draft class. A fate they would have had if just using raw Total Points.

    Now, answering the second question takes into account how well a team drafted throughout the entirety of the draft class. I found the average Total Points per player from the 2019 class at each position, including UDFAs who have taken at least one offensive or defensive snap, since they were also available to be selected.

    The positional averages are shown in the table below.

    Pos TP per Player
    QB 38.1
    RB 8.8
    WR 15.7
    TE 11.2
    OL 25.3
    ED 29.1
    DT 19.8
    LB 23.5
    CB 23.2
    S 30.2


    The TP Score, as referenced earlier, is what’s used to rank the teams. It is calculated as follows:

    1. Add up the Total Points from the entire team’s draft class

    2. Divide that number by the number of selections the team had

    3. Multiply that number by the percentage of draft picks that were above the average Total Points for their given position

    4.Add that to the original Total Points per draft pick

    In these 4 steps, we are essentially answering how productive the draft class was and how many picks were “hits”.

    Let’s run through an example using the Chicago Bears.

    Here is their Draft class:

    Pos Player Total Points
    RB David Montgomery 45
    WR Riley Ridley 4
    CB Duke Shelley 21
    RB Kerrith Whyte Jr. 2
    CB Stephen Denmark 0
    1. Add up the Total Points from the entire team’s draft class
    72
    2. Divide that number by the number of selections the team had
    72 Total Points divided by 5 selections equals 14.40
    3. Multiply that number by the percentage of draft picks that were above the average Total Points for their given position
    David Montgomery was the only player whose Total Points were above average
    14.40 times 20% (1 out of 5) equals 2.88
    4. Add that to the original Total Points per draft pick
    14.40 plus 2.88 equals 17.28, which is their TP Score


    So, to summarize, we took the team’s Total Points gained from these players, dispersed it throughout the entire class and then gave a bump based on how many above-average players they drafted.

    Now that we know how the teams ranked and how the TP Score is calculated, let’s dive into some of the details.

    Other Key Takeaways

    – The Raiders “hit” on 7 of their 9 picks. It is interesting to note that all three of their 1st-Round picks, Clelin Ferrell, Josh Jacobs, and Johnathan Abram, had their 5th-Year Options declined. However, they still played well enough to be above-average players. Plus, that doesn’t include gems they found later in the draft in Maxx Crosby and Hunter Renfrow.

    – Every team drafted at least one player who has played above the positional average compared to the rest of the draft class. However, Dallas (Trysten Hill), New England (N’Keal Harry), Philadelphia (Andre Dillard), Seattle (L.J. Collier), and Washington (Dwayne Haskins) were the only teams whose first draft selection wasn’t an above-average player.

    – The Cardinals draft class accumulated the most Total Points with 446, though as mentioned before, Kyler Murray accounted for 286 of them. They hit on 3 of 11 draft picks on their way to a No. 7 ranking. It’s worth noting that their Supplemental Draft selection of Jalen Thompson and his 73 Total Points isn’t included, as he isn’t part of their original draft class.

    – The fewest Total Points came from the Eagles. They garnered only 51 Total Points across their five draft picks, with 43 coming from Miles Sanders.

    – Hitting on quarterbacks is pivotal to winning in the NFL, as seen by Kyler Murray in 2019. Conversely, missing on quarterbacks can set teams back. Carolina and Cincinnati both took quarterbacks who severely hurt their Total Points number and pushed them down the rankings, even in minimal games played.

    Will Grier accounted for -26 Total Points out of Carolina’s 89 total. Funny enough, Brian Burns had 91 himself. Ryan Finley was even worse for Cincinnati with -39. In nine games in which Grier and Finley played and threw at least one pass, they combined for a 1-8 record.

    It’s possible the teams had a better chance of winning if neither played. If both had never played and accumulated 0 Total Points, Carolina would have improved four spots in the rankings and Cincinnati would have improved three spots.

    How do our Initial Grades Compare?

    56% (18/32) of our initial ranks were in the correct half. Meaning a team we ranked between 1 and 16 or 17 and 32 was ultimately in that tier. And before I get too much further, I want to make sure it’s understood that 2019 was our first year of the Handbook which meant there were plenty of growing pains. Major changes took place beginning in 2020 after studying our initial process.

    The biggest differences in our initial grades and these final rankings were the Bengals (25 spots), Eagles (23 spots), and the Ravens (23 spots). We rated these teams near the top immediately following the draft, but they finished near the bottom based on these rankings.

    For Cincinnati, we’ve already talked about Ryan Finley (who was our No. 4 QB), but they also drafted two running backs. Rodney Anderson (SIS No. 4 RB) has battled injuries his entire career and Trayveon Williams (SIS No. 5 RB) has been buried on the depth chart and has seen minimal playing time.

    The Eagles took four of five players who were featured in the Handbook, with Miles Sanders and Andre Dillard both grading out as a 6.7. As mentioned earlier, Dillard was one of the top picks who has failed to be an above-average player. For Baltimore, all eight selections were in the Handbook, and we graded six of them at 6.4 or higher. They clearly have underperformed based on our initial grading.

    What were some of our biggest misses elsewhere? Not including Mecole Hardman or Sean Murphy-Bunting proved to be a big miss. As mentioned before, immediate action was taken to improve upon our process to make sure we weren’t missing good players and early draft picks.

    Additionally, we ranked Wisconsin OG Beau Benzschawel as our No. 4 guard and New Mexico State LB Terrill Hanks as our No. 5 linebacker. Neither have played a snap in the NFL.

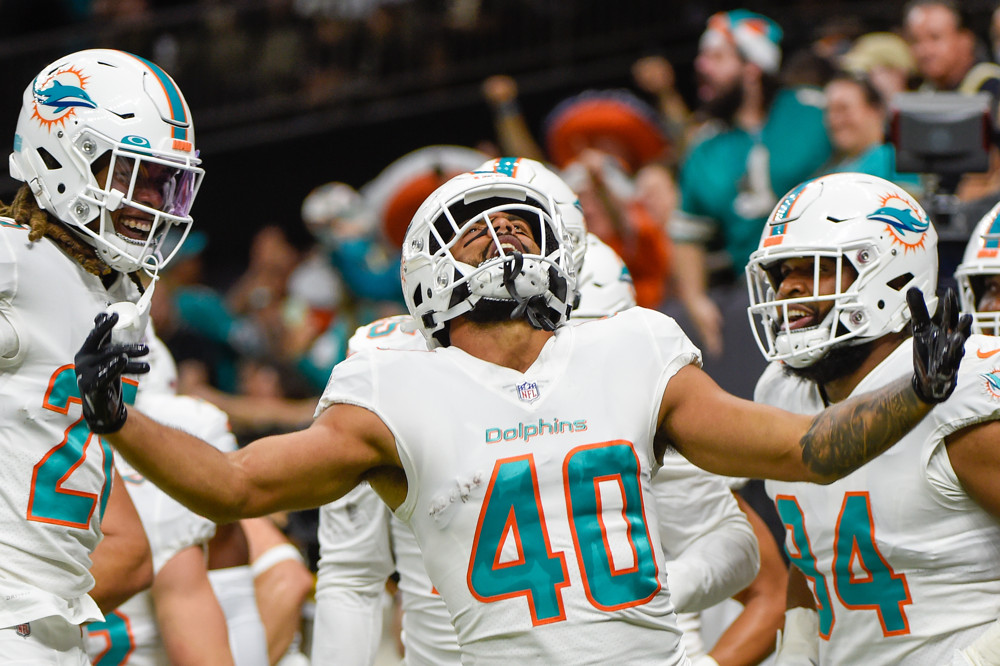
    Nik Needham is first and foremost when we talk about our NFL Draft wins. He’s been a big talking point around the company for the past three years. We ranked him as our No. 4 corner going into the draft, and he currently ranks third in Total Points among 2019 CBs (we were higher on him than any other mainstream draft analyst). His 85 Total Points tops all UDFAs from the 2019 class and ranks 12th overall.

    The table below shows the top Total Points earners across the past three seasons and how we graded and ranked them in the Handbook.

    Rank Position Player Total Points SIS Grade SIS Pos Rank
    1 QB Kyler Murray 286 6.8 2
    2 ED Nick Bosa 120 7.0 1
    3 LB Devin White 99 7.0 1
    4 CB Jamel Dean 97 6.7 6
    T-5 ED Maxx Crosby 96 6.5 11
    T-5 CB Byron Murphy 96 6.9 3
    T-5 WR Deebo Samuel 96 6.7 4

    While we were a little low on Dean and Crosby, all eight of these guys were tabbed as starters in some form by our scouts.

    Conclusion

    Nobody really knows how a draft class is going to turn out immediately after the draft, as stated before, yet it still makes sense to grade and rank the teams based on player grades for an initial reaction. Post-draft grades are great in a sense, but they should be taken with a grain of salt. Once three years go by and we’ve seen what these players have done in the NFL, we can get a better sense of how good the team drafted.

    These rankings are all about finding which teams drafted the best draft class as a whole, not just who got the best player. While there are some players who didn’t play for the team that drafted them for the entirety of the past three seasons, that wasn’t taken into account since those decisions came after the initial drafting of these players, which is what this is based off of. It’s not a perfect science, but it does a good job at pulling player value and seeing how well teams drafted as a whole class.

    Three years later, the comparison between our initial rankings and these rankings aren’t terrible for Year 1 (in both our grading and our scouting process). Though, we hope this article next year takes a large positive swing given the process changes we made heading into the 2020 cycle.

    As with everything we do here, we hope this improves year over year and can look back and say we kept getting better every day.

    Appendix

    2019 SIS Post-Draft Rankings based on the SIS Football Rookie Handbook

    Team Book Rank Grade
    Titans 1 6.63
    Bills 2 6.50
    Cardinals 3 6.46
    Ravens 4 6.44
    Bengals 5 6.44
    Raiders 6 6.40
    Broncos 7 6.38
    Eagles 8 6.34
    Jaguars 9 6.33
    Cowboys 10 6.30
    Patriots 11 6.30
    Rams 12 6.30
    Falcons 13 6.29
    Giants 14 6.28
    Panthers 15 6.24
    Packers 16 6.24
    Dolphins 17 6.22
    Steelers 18 6.21
      Commanders 19 6.21
    49ers 20 6.20
    Buccaneers 21 6.20
    Jets 22 6.20
    Texans 23 6.17
    Vikings 24 6.14
    Bears 25 6.14
    Chargers 26 6.13
    Colts 27 6.12
    Saints 28 6.12
    Browns 29 6.10
    Seahawks 30 6.03
    Lions 31 6.00
    Chiefs 32 5.90

    TP Rank based on TP Score and how much value each team got from their draft picks over the last three seasons

    Team TP Rank TP Score
    Titans 1 84.64
    Broncos 2 82.81
    Raiders 3 77.23
    Buccaneers 4 67.50
    Jaguars 5 62.18
    49ers 6 60.19
    Cardinals 7 51.60
    Packers 8 48.38
    Saints 9 48.16
    Chiefs 10 44.50
    Commanders 11 43.68
    Dolphins 12 41.00
    Giants 13 40.80
    Texans 14 37.96
    Bills 15 36.00
    Rams 16 34.72
    Jets 17 32.89
    Browns 18 30.00
    Colts 19 29.25
    Lions 20 27.77
    Falcons 21 25.16
    Vikings 22 22.00
    Cowboys 23 21.72
    Steelers 24 18.81
    Patriots 25 18.60
    Bears 26 17.28
    Ravens 27 16.25
    Chargers 28 16.00
    Panthers 29 14.53
    Bengals 30 12.48
    Eagles 31 12.24
    Seahawks 32 10.12


  • Study: College Football Injury Overview

    Study: College Football Injury Overview

    Every player in our NFL Draft site has had their injury history reviewed. Each player page has a space to indicate two types of injury designations: long-term injury risk or currently injured. Long-term injury risk measures how problematic or detrimental a player’s injury history may affect  their participation at the next level. If a player is deemed to be at high risk of injury he is given a red flag. Moderate risk players are given a yellow flag and low-risk players are given a green flag. 

    This season, each long-term injury risk flag was determined and supported by published research. Injuries such as ACL tears, spinal injuries and shoulder injuries requiring surgery are likely to prompt a yellow or red flag depending on the player’s position.

    For example, meniscectomies (surgery to treat damaged meniscus) to specifically linemen, running backs, defensive backs and linebackers have been a significant hindrance to the number of snaps and games played in the NFL – and thus given a red flag.1

    This isn’t to say that unnamed position groups are scot-free with a history of meniscal damage, but there is simply evidence that the named groups are at a higher risk.

    Currently, 77% of the players in the SIS NFL Draft site have been given a green flag. They carry unremarkable injury histories to suggest long-term injury risks leading up to the big draft day. Many of these players have been injured in college and high school, but the injuries have little cause for concern. 

    The yellow flag has been given out to 20% of the players as moderate risk which leaves 3% for the dreaded red flag. The ‘currently injured’ tag is used for players dealing with an injury that will limit their participation in the draft process, but will not necessarily have lasting effects during their career. For example, Jeremy Ruckert has not been able to participate at the combine or Ohio State’s pro day due to a minor foot injury. 

    All of the 2021 injury data displayed below has been collected here at Sports Info Solutions. The injury data is accumulated via our Video Scouts recording every injury event that occurred in the FBS. Every tagged injury is video-audited by our injury department and updated using media reports until the player has healed. Along with tagging the injured players during a play, scouts will also record the initial injury severity, using a scale from 1 to 5 with objective definitions.

    • Severity 1 equates to an apparent injury with no visible reaction by a player. These are particularly difficult to notice, like when a lineman gets rolled up on from behind but shows no signs of pain after the play. 
    • Severity 2 occurs when a player physically shows pain, but stays on the field for at least one more play. 
    • Severity 3 takes place when an injury forces a player to remove himself from a play.
    • Severity 4 happens when the player requires a timeout on the field prior to receiving assistance leaving the field. 
    • Severity 5 injury is reserved for an extreme situation when a player requires a cart or stretcher to be removed from the field. 

    Injuries by Team

    Below are the 25 most-injured teams in the FBS during the 2021 season. The table breaks down each team’s injuries by two initial severity groups – Severe (4, 5) and Not Severe (1, 2, and 3). The injuries column is the sum of all in-game injuries tagged and off-field injuries reported. Games missed equates to the total number of absences due to injury for the entire team over the course of the season.

    Tennessee tops the list at 81 in-game injuries in 2021 and happened to suffer the 15th-most injuries of 2020 as well. Oregon and Clemson stand out in total games missed due to injury over the season. Both teams had relatively successful seasons despite having to overcome tremendous absences.

    Last season’s most often injured team, Florida State, turned things around by being outside of the 75 most injured teams of 2021. FSU made this reversal while bringing on the only quarterback to be tagged with the red flag, McKenzie Milton.

    Milton suffered a devastating dislocated right knee in a game during the 2018 season. Surgery saved his leg after ligament, arterial and nerve damage threatened his chances of ever playing again. He was able to play 6 games in 2021 after 2 seasons of rehabilitation. He’s a talented player, but his injury will be something NFL Draft war rooms discuss when Milton’s name is brought up.

    Team Conf Severe Not Severe Injuries Games Missed
    Tennessee SEC 60 21 83 39
    Texas A&M SEC 34 32 77 63
    Pittsburgh ACC 55 21 77 24
    Penn State BIG10 26 41 69 11
    Oregon PAC12 29 25 68 105
    Rice CUSA 45 23 68 31
    Virginia Tech ACC 39 21 67 46
    Texas BIG12 36 22 66 41
    Virginia ACC 34 27 66 24
    Georgia Tech ACC 37 22 66 22
    Kentucky SEC 46 17 65 17
    North Texas CUSA 41 22 64 31
    Clemson ACC 24 23 63 97
    Arizona State PAC12 26 26 63 51
    Ole Miss SEC 43 18 63 10
    Wisconsin BIG10 21 22 61 49
    Purdue BIG10 30 22 60 57
    Alabama SEC 21 25 59 58
    Eastern Michigan MAC 46 12 58 20
    Colorado State MW 28 26 58 14
    Oklahoma State BIG12 19 24 57 43
    Utah State MW 35 19 55 22
    Mississippi State SEC 22 60 54 12
    Indiana BIG10 32 17 53 49


    Injuries by Position

    When taking a look at injuries that occur during a game, it’s particularly interesting to break down the data by position. In the positional table below, the ‘Severe’ and ‘Severe%’ columns denote injuries that were charted as Severity 4 or 5. The 2021 data aligns with the same findings in the previous 2 seasons – the defensive line is the most dangerous position to play.

    We have 6 defensive linemen with a red flag and another 17 with a yellow flag. Particularly concerning injuries for the d-line are shoulder injuries that damage the rotator cuff, labrum, or capsule causing instability to the joint. Defensive linemen with these injuries have historically had a shorter career in the league and a decreased chance of being drafted.2

    Tyler Johnson of Arizona State is one of those players with an unfortunate history of a shoulder labrum and rotator cuff injury in 2018. He admitted he almost retired due to the pain that lingered in his shoulder over the course of the following season.

    PositionName Injuries Games Missed Severe Severe %
    DL 873 408 646 79%
    WR 873 583 267 35%
    LB 720 431 481 72%
    QB 658 431 139 23%
    CB 673 418 451 74%
    RB 610 316 181 33%
    OL 601 533 402 75%
    S 542 387 358 71%
    TE 250 239 89 41%


    Injuries by Body Part


    When the 2021 injury data is broken down by region injured it’s no surprise to see knee and ankle injuries at the top of the totals. There were 1,386 injury timeouts (severity 4) in FBS due to knee and ankle injuries alone. When speaking of knees, the dreaded ACL tear is often spoken of in an overly cautious manner for these prospects.

    Surprisingly, a single instance of an ACL tear and reconstruction only warrants a yellow flag for all position groups besides OL, DL and LB (red flag). Historically, prospects from all positions with an ACL injury have been picked lower in the draft on average.4 This could perhaps lead to hidden value in players like George Pickens, Treylon Burks, John Metchie and Jameson Williams who all have been given a yellow flag. 


    Part Injuries Games Missed
    Knee 1065 1186
    Ankle 897 530
    Shoulder 582 314
    Neurological 560 154
    Calf 243 35
    Chest 179 37
    Hamstring 155 33
    Hand 127 69
    Ribcage 105 28
    Foot 90 180


    Injury Designations

    The player injury designation table summarizes only the players within the draft site who have been identified in their player profile as having at least one of a yellow flag, red flag, or currently injured tag. On this list you will see players such as Justyn Ross as he has dealt with a congenital fusion in his cervical spine plus a stress fracture in his foot – both requiring surgery. 


    Position Player Red Flag Yellow Flag Currently Injured
    QB Davis Cheek, Elon x
    QB EJ Perry, Brown x
    QB D’Eriq King, Miami FL x
    QB McKenzie Milton, Florida State x
    QB Skylar Thompson, Kansas State x
    QB Jack Coan, Notre Dame x
    QB Carson Strong, Nevada x
    RB Vavae Malepeai, USC x
    RB Brittain Brown, UCLA x
    RB LD Brown, Oklahoma State x
    RB Shamari Brooks, Tulsa x
    RB Ronnie Rivers, Fresno State x
    RB Jerrion Ealy, Ole Miss x
    RB Zamir White, Georgia x
    RB Malik Davis, Florida x
    RB Kevin Harris, South Carolina x
    RB Master Teague III, Ohio State x
    RB Cam’Ron Harris, Miami FL x x
    RB Mataeo Durant, Duke x
    RB Ricky Person, Jr., NC State x
    RB Zonovan Knight, NC State x
    RB Max Borghi, Washington State x
    RB Kennedy Brooks, Oklahoma x
    RB Abram Smith, Baylor x
    WR Drake London x
    WR Christian Watson, North Dakota State x
    WR Demetris Robertson, Auburn x
    WR Changa Hodge, Virginia Tech x
    WR Reggie Roberson, Jr., SMU x
    WR Corey Sutton, Appalachian State x x
    WR George Pickens, Georgia x
    WR Treylon Burks, Arkansas x
    WR John Metchie, Alabama x x
    WR Jameson Williams, Alabama x x
    WR David Bell, Purdue x
    WR Justyn Ross, Clemson x
    WR Tre Turner, Virginia Tech x
    WR Britain Covey, Utah x
    WR Jalen Tolbert, South Alabama x
    WR Khalil Shakir, Boise State x
    TE Nick Muse, South Carolina x
    TE Trae Barry, Boston College x
    TE Chase Allen, Iowa State x
    TE John FitzPatrick, Georgia x
    TE Jeremy Ruckert, Ohio State x
    TE Peyton Hendershot, Indiana x
    TE Austin Allen, Nebraska x
    TE Braden Galloway, Clemson x
    TE James Mitchell, Virginia Tech x x
    TE Charlie Kolar, Iowa State x
    OL Justin Shaffer, Georgia x
    OL Thayer Munford, Ohio State x
    OL AJ Arcuri, Michigan State x
    OL Navaughn Donaldson, Miami FL x
    OL Jarrid Williams, Miami FL x
    OL Jack Wohlabaugh, Duke x
    OL Denzel Okafor, Texas x
    OL Josh Sills, Oklahoma State x
    OL Zachary Thomas, San Diego State x
    OL Chasen Hines, LSU x
    OL Brodarious Hamm, Auburn x
    OL Case Cook, Missouri x
    OL Andrew Stueber, Michigan x
    OL Alec Anderson, UCLA x
    OL Dawson Deaton, Texas Tech x
    OL Luke Goedeke, Central Michigan x
    DL Jayden Peevy, Texas A&M x
    DL Perrion Winfrey, Oklahoma x
    DL Kobie Whiteside, Missouri x
    DL Julian Rochester, Georgia x
    DL Miles Fox, Wake Forest
    DL Keyshon Camp, Pittsburgh x
    DL Ralfs Rusins, Liberty x
    DL Jordan Jackson, Air Force x
    DL DeMarvin Leal, Texas A&M x
    DL Kalia Davis, UCF x
    DL Viane Moala, Utah x
    DL Jeremiah Moon, Florida x
    DL Ryder Anderson, Indiana x
    DL Tomon Fox, North Carolina x
    DL Ryan Bowman, Washington x x
    DL Scott Patchan, Colorado State x
    DL Arron Mosby, Fresno State x
    DL Christopher Allen, Alabama x
    DL Kingsley Enagbare, South Carolina x
    DL David Ojabo, Michigan x x
    DL Tyreke Smith, Ohio State x
    DL Luiji Vilain, Wake Forest x
    DL Tyler Johnson, Arizona State x
    DL Mika Tafua, Utah x
    DL Alex Wright, UAB x
    LB Troy Andersen, Montana State x
    LB James Houston IV, Jackson State x
    LB Aaron Hansford, Texas A&M x
    LB JoJo Domann, Nebraska x
    LB Jake Hansen, Illinois x
    LB James Skalski, Clemson x
    LB Nate Landman, Colorado x
    LB Riley Whimpey, Boise State x
    LB Damone Clark, LSU x x
    LB Nakobe Dean, Georgia x
    LB Jaylan Alexander, Purdue x
    LB Khalan Tolson, Illinois x
    LB Nephi Sewell, Utah x
    LB Terrel Bernard, Baylor x
    LB Drew White, Notre Dame x
    LB Chad Muma, Wyoming x
    DB Matt Hankins, Iowa x
    DB Coney Durr, Minnesota x
    DB Caesar Williams, Wisconsin x
    DB Meiko Dotson, Florida State x
    DB Damarri Mathis, Pittsburgh x
    DB Christian Holmes, Oklahoma State x
    DB Derek Stingley Jr., LSU x
    DB Josh Jobe, Alabama x x
    DB Jalyn Armour-Davis, Alabama x
    DB Montaric Brown, Arkansas x
    DB Akayleb Evans, Missouri x
    DB Faion Hicks, Wisconsin x
    DB Jermaine Waller, Virginia Tech x
    DB Andrew Booth Jr., Clemson x x
    DB Mario Goodrich, Clemson x
    DB Josh Blackwell, Duke x
    DB Isaac Taylor-Stuart, USC x
    DB Josh Thompson, Texas x
    S Jaylon Jones, Ole Miss x
    S Cameron Lewis, LSU x
    S Deontai Williams, Nebraska x
    S Marquel Dismuke, Nebraska x
    S Marcelino McCrary-Ball, Indiana x
    S Nolan Turner, Clemson x
    S De’Vante Cross, Virginia x
    S Tariq Carpenter, Georgia Tech x
    S Tycen Anderson, Toledo x
    S Shaq Bond, Utah State x
    S Daniel Wright, Alabama x
    S Smoke Monday, Auburn x
    S Scott Nelson, Wisconsin x
    S Bubba Bolden, Miami FL x
    S Isaiah Pola-Mao, USC x
    S Kolby Harvell-Peel, Oklahoma State x
    S Tre Sterling, Oklahoma State x
    S Jalen Pitre, Baylor x
    S Kyle Hamilton, Notre Dame x
    S Percy Butler, Louisiana x

    References

    1. Brophy RH, Lyman S, Chehab EL, Barnes RP, Rodeo SA, Warren RF. Predictive value of prior injury on career in professional American football is affected by player position. Am J Sports Med. 2009;37(4): 768-775.
    2. Brophy RH, Gill CS, Lyman S, Barnes RP, Rodeo SA, Warren RF. Effect of shoulder stabilization on career length in National Football League athletes. Am J Sports Med. 2011;39(4):704-70.
    3. Kluczynski, M., Kelly, W., Lashomb, W., & Bisson, L. (2019). A Systematic Review of the Orthopaedic Literature Involving National Football League Players. Orthopaedic Journal Of Sports Medicine, 7(8).
    4. Provencher MT, Bradley JP, Chahla J, et al. A history of anterior cruciate ligament reconstruction at the National Football League Combine results in inferior early National Football League career participation. Arthroscopy. 2018;34(8):2446-2453.
    5. Wang, D., Weiss, L., Abrams, M., Barnes, R., Warren, R., Rodeo, S., & Taylor, S. (2018). Athletes With Musculoskeletal Injuries Identified at the NFL Scouting Combine and Prediction of Outcomes in the NFL: A Systematic Review. Orthopaedic Journal Of Sports Medicine, 6(12).
  • Study: What Is So Dangerous About Special Teams Plays? 

    Study: What Is So Dangerous About Special Teams Plays? 

    An In-Depth Observational Analysis of Injuries that Occurred During Kickoff and Punt Plays Between the 2017-2021 Seasons: Part 1 

    Introduction 

    For years, we have been told how dangerous special team plays are, especially kickoffs and punts. Theoretically, it makes sense as we have elite athletes running at high speeds to engage in violent collisions with one another. That sentence alone makes me want to avert my eyes, but I can’t help my desire to watch the action unfold. Are these plays as dangerous as they are made out to be? 

    The NFL believes this is the case and continues to review and implement rule changes during the offseason for player safety. Their forward actions should be applauded, as injuries are an inevitable consequence due to the nature of the sport but should be minimized to whatever degree possible. Injury prevention is more of a pipe dream than a realistic goal, but risk reduction is what all parties are hoping to attain. 

    Luckily, SIS has the data to assess the situation and investigate the relationship between injuries and specific play types. This article will focus on the relationship between injuries during kickoff and punt plays compared to other plays at the pro and collegiate levels. We will then compare the two levels to one another to identify any discrepancies that presented themselves. 

     Breakdown of Injury Data 

    First, it’s important to understand the proportion of these two play types in the totality of all plays. Special teams accounts for between 17-18% of plays in each season, and kickoff and punts will make up around 11-12% on their own.  

    SIS scouts have identified 7,294 in-game injuries at the Pro level between the seasons of 2017-2021 and over that time our Injury Analysts have reviewed the film of each injury and cross-referenced injury reports to provide the most up-to-date and accurate information. 

    From our data, injuries on kickoff and punt plays account for 7% of all in-game injuries. Although that percentage does not appear concerning, it is the areas involved and the severity of these injuries that are alarming. Previous investigations identify the head and knee regions as areas of concern. Our data will provide a thorough analysis of these two regions as well as other concerning trends found during this investigation. 

    Examination of Head and Knee Injuries at the Professional Level 

    The proportion of head injuries between kickoff and punt plays compared to other plays stands out. Injuries involving the head account for 18.5% of the injuries that occurred on kickoff and punt plays compared to 13.4% on the other play types (alpha= 0.05, p < .01). 

    NFL Injury Breakdown by Injury Region and Play Type for 2017-21. Lower extremity injuries are most common overall, with head and knee injuries being more common on kickoffs/punts.

    Assessing knee injuries on these specific play types sheds a different light. Knee injuries account for 23.8% of the injuries that occurred during kickoffs and punts compared to the 20.7% during the other play types (alpha= 0.05, p = 0.03). Though the gap between these proportions is smaller than what the head region revealed, things get interesting when you observe the specific knee diagnoses involved.  

    The alarming revelation appears when you evaluate the disparity of proportions between anterior cruciate ligament (ACL) injuries of these play type groupings. Confirmed ACL injuries account for 19.2% of the knee injuries that transpired on kickoffs and punts compared to 6.9% during other plays (alpha= 0.05, p < .01). 

    As most football fans know, ACL injuries will likely require a season-ending reconstruction surgery. Although the likelihood of a return to previous performance levels has improved, the duration of the rehab is lengthy and can vary greatly between athletes. 

    Examination of Head and Knee Injuries at the Collegiate Level 

    Next, we’ll examine the relationship between play types and injuries at the collegiate level. Since full disclosure of college injury diagnoses are difficult to verify, this analysis will focus on general regions. Like the NFL, the proportion of kickoff and punt plays follow the same ratio accounting for 11-12% of total plays. 

    SIS scouts identified 21,894 in-game injuries between the 2017-2021 seasons. As stated above, our Injury Analysts reviewed each play to identify the region affected during the play and updated that injury information accordingly.  

    From our data, 5.6% of the identified in-game injuries occurred during kickoff or punt plays. As we will see, the areas involved during those injuries stand out when comparing the regional distribution and their corresponding proportions between the play types of interest. 

    NCAA Injury Breakdown by Injury Region and Play Type for 2017-21. Lower extremity injuries are most common overall, with head and knee injuries being more common on kickoffs/punts.

    Injuries involving the head during kickoff and punt plays account for 18.6% of our recorded injuries compared to 12.8% during the other play types (alpha= 0.05, p < .01). In addition, an injury sustained during a kickoff or punt play involved the knee 29.8% of the time compared to 26.1% for the other group of plays (alpha= 0.05, p < .01). 

    Once again, the data suggests that the head and knee regions are more likely to be involved when an injury occurs during a kickoff or punt play.  

    Comparison between College and the Pros 

    A major discrepancy presented itself when the injury proportional data was compared between the two levels. Regardless of the type of play involved, college players’ knees were more likely to involved with the injury.

    NFL vs NCAA injury rates by body region. Lower leg / knee injuries are much more common in NCAA.  

    It is a peculiar phenomenon that proved to be significant. Retrospective research studies regarding football injuries identify the knee as an area of concern. We have gathered that the knee is the most at-risk region to be affected by an injury during a football game. The risk of involvement appears to increase at the collegiate level, in addition to during kickoff and punt plays.  

    Why do college players’ knees appear to be at higher risk compared to the pros? Is it the style of play between the levels or some other factor involved? Speculation could be drawn that the greater proportion of elite athletes at the professional level may decrease the knees’ involvement during injuries at that level. Another factor could be the increased variations of formations at the college level compared to the pros. More research is needed to understand this difference. 

    Further Research 

    Questions present themselves after observing this data. Questions like: Why do the head and knee regions appear to be more involved during kickoffs and punts? Other disproportions were apparent after examining the data that were not investigated further within this study. One example is the higher proportion of ankle and foot injuries at both levels during the other play types. 

    As one of the Injury Analysts at SIS, I hypothesize that the higher proportion of ankle and foot injuries appears because of the common mechanism of injury I witness while reviewing plays. Many ankle injuries occur at the line of scrimmage where linemen are engaged with one another and subsequently get rolled up on by another player. Eliminating this type of action from a kickoff and punt play would decrease the likelihood of the ankle being involved when an injury occurs. 

    The other disproportion that was not investigated further was the difference within the upper leg and thigh region between the play type groupings. Most injuries to that region involve a muscle strain. I elaborated on muscle strains, specifically hamstrings, during a threepart series at the beginning of this past season. A common mechanism of a muscle strain involves high velocity running, which is more likely to occur for a greater number of athletes on the field during a kickoff or punt play. I suspect that may be the culprit behind that region’s higher involvement during kickoffs and punts. 

    The goal of this observational analysis was to examine the data and evaluate the relationship between the varying play types and the injuries that occurred. It proved to be fruitful, and it will lead to further studies to help identify variables that may be contributing to the results. The next article will continue this investigation by focusing on the kickoff and punt plays individually. We will utilize our data to observe the injuries within different conditions and evaluate the players affected to enhance our understanding at what transpires during these plays. 

  • What Do Russell Wilson & Carson Wentz Bring Their New Teams

    What Do Russell Wilson & Carson Wentz Bring Their New Teams

    Russell Wilson – Denver Broncos

    Denver has continued to seek a quarterback since Peyton Manning’s Super Bowl winning team in 2015-16, with a revolving door of “wow, remember him?” names, including Trevor Siemian, Brock Osweiler, Paxton Lynch, Case Keenum, Joe Flacco, Drew Lock, and more. It should come as no surprise they were very aggressive in acquiring a QB they can trust.

    Sending Drew Lock, Noah Fant, Shelby Harris, multiple first round picks, and more throw-ins to Seattle, the Broncos acquired the quarterback who defeated them 43-8 in Super Bowl XLVIII. Will the investment be worth it?

    Russell Wilson is coming off an up-and-down 2021 season, where he posted a statline of 3,113 yards, 65% completion percentage, 25:6 TD:INT, with 9.3 Passing Total Points Per 60 Plays, good for 18th-best among QBs with at least 100 attempts. Looking back at the first half of 2020 while he was an MVP candidate, his 15.6 Total Points Per 60 Plays, third best in the league. Aggregating over the last two seasons, WIlson ranks just inside the Top 10.

    Drew Lock recorded 5 Passing Total Points Per 60 Plays in 2020, ranking 28th in the league, and Bridgewater’s 10.0 in 2021 was 14th-best, which ranked a smidge higher than Wilson. It should be noted that Wilson was struggling with a finger injury for most of those games.

    The Broncos of the future are going to hold a different identity, and it isn’t just from the QB change. Vic Fangio was fired, and former Green Bay offensive coordinator Nathaniel Hackett is taking over as Head Coach. While Hackett was not the primary play caller, he was heavily involved in devising the game plans that gave Aaron Rodgers back-to-back MVP awards. 

    The 2021 Packers mostly operated out of 11 personnel, but their 12 personnel usage ranked 2nd-highest, and they ranked 4th-highest in 4 WR sets. Trading Fant to Seattle suggests that Denver might not be leaning too hard on the 2 TE packages, but the four-wide looks would be a new feel for Wilson.

    The 2021 Packers called more passes with four receivers on the field than the Seahawks did the last three years combined.

    The Packers used motion at the fifth-highest rate in the league, on 54% of plays, a stark contrast to the third-lowest 31% motion rate by the Seahawks. This is one of a number of ways in which the offense Wilson leaves was a bit stale.

    Rodgers was extremely effective in short dropbacks, with a league high 118.5 IQR (SIS Independent Quarterback Rating, which factors out things outside a QBs control like dropped passes and dropped interceptions). Comparably, Wilson ranked 9th at 103.0, and Bridgewater 14th at 97.1.

    Even on short drops, Wilson separates himself with his downfield aggression and willingness to let the play develop. He ranked one spot better than Rodgers in IQR on deep drops, with a throw depth of 18.9 yards on average, much higher than any other QB (Rodgers was at 11.5). This was all under a league-high pressure rate of 54.5%, which it should be noted is partly his doing by extending plays. Wilson continues to be one of the league’s best on deep drops with long throws.

    With a receiving room of Jerry Jeudy, Courtland Sutton, Tim Patrick, Albert Okwuegbunam, and KJ Hamler, Wilson will have weapons at all levels of the field, even if the top two aren’t in the same tier of Tyler Lockett and DK Metcalf.

    Denver paid a high price to find some consistency at the QB position. The Broncos were in the postseason mix last year at 7-10, and with Wilson’s improvements and an offensive scheme that will resemble 2021’s best, they could be considered contenders. Right now, they sit at the 5th-highest odds to win the Super Bowl at 12-1, which is impressive considering the other teams in their division.

    Carson Wentz – Washington Commanders

    After striking out on Matthew Stafford, Aaron Rodgers, and Russell WIlson, the Commanders found themselves looking at yet another year with a QB desire. With a new name, logo, and uniform set, Washington opted to trade for former division rival Carson Wentz, giving multiple mid-round picks to Indianapolis in the deal.

    Washington has continuity in head coach Ron Rivera. After a year as the second-most frequent users of play action, they found a QB that came from the 4th-highest play action team in Indianapolis, meaning Wentz will be asked to do a lot of the same. 

    On play-action passes, Wentz performed the same or slightly worse than the incumbent Washington QB, Taylor Heinicke, in all of IQR, Total Points Per Play, Positive %, Completion %, On-Target %, and Adjusted Net Yards Per Attempt, among many others. Simply put, Wentz is probably a lateral move..

    Both of these quarterbacks have reputations of making things happen when things go awry, but in 2021 they were both middling at best.

    Carson Wentz vs. Taylor Heinicke, 2021, Under Pressure

    Comp% On-Target% IQR Sack%
    Wentz 47.5% 59% 72.2 16%
    Heinicke 53.0% 66% 71.0 21%


    Where Wentz shows up as an improvement over Heinicke is when the pocket stays clean. This is particularly true on non-play-action dropbacks, but it shows across all unpressured dropbacks.

    Carson Wentz vs. Taylor Heinicke, 2021, Clean Pocket

    Comp% On-Target% IQR INT%
    Wentz 69.3% 77% 108.3 1%
    Heinicke 69.4% 73% 81.1 3%

    The bottom line for Washington fans is, not great. Wentz comes at a much higher salary than Heinicke, and if his 2021 performance is to continue, he offers an improvement on vanilla dropbacks with clean pockets but is at best as good as Heinicke otherwise. He is a good enough starter to keep Washington out of the league’s cellar where many teams acquire their QBs of the future, but I’m reserved on calling them a playoff team yet.

    For more on the QB carousel, check out the latest edition of the Off The Charts Football Podcast.

  • How do we evaluate Pittsburgh QB Kenny Pickett?

    How do we evaluate Pittsburgh QB Kenny Pickett?


    On the most recent episode of the Off The Charts podcast, we explained our football draft prospect scouting process. We went through the different factors our scouts consider, what they watch for as they watch film, and used a specific player to show how we do what we do.

    For quarterbacks, we looked at Kenny Pickett from Pittsburgh.

    Here’s how one of our lead editors of our upcoming NFL Draft website, Nathan Cooper, came up with his grade.

    We require watching at least four games on a specific player per report.

    For quarterbacks, you’re going to watch more than four. I watched nine on Trey Lance last year.

    The hardest part about this process is that college offenses don’t always translate to the NFL. It’s hard to find guys in college who are doing exactly what he’s going to be asked to do. You have to find the traits, project the traits, and see as many NFL-worthy plays as you can, and rate those slightly higher than the rest.

    There are 15 factors on which we grade a quarterback. Three are what we call critical factors that we put a higher value on than the other 12 factors. We grade on a scale of 1 to 9, though most of our factor grades end up either 4, 5, 6, or 7. The three critical factors for quarterbacks are accuracy decision-making and mental processing, and clutch performance.

    Accuracy

    When you think of accuracy, a lot of people think of completion percentage and for us as data collectors and even as evaluators, it goes a lot deeper than that. We’re not only looking for the ball to be caught, but was it catchable? Was it on target? Did he give the receiver a chance to make a play?

    We look at the short passes, the intermediate passes and then deep down the field. Everyone obviously expects, passes to be completed a higher rate whenever you’re in the shorter areas of the field.

    With accuracy, he’s not always spot-on with his short passes, his swings and flats are a little behind. He lacks a bit of touch on his shorter throws as well, so I don’t love that aspect about him. But he has a very good touch on the deep ball. He’s money from 25 to 35 yards.

    I do worry about arm strength with him, about getting much deeper than 25 to 35 yards on his throws.

    So I would give him a 5 overall for accuracy. But if you broke it down, I’d say a 5 on short passes and a 6 on deep.

    Decision Making/Mental Processing

    For decision making, there are a lot of factors. We’re looking at the ability to make smart decisions, but also mental processing.

    • How well does he read the field?
    • How well does he process what the defense is doing?
    • Is he poised in the pocket or flustered under pressure?
    • Does he sense pressure and hang in?
    • Is he waiting for receivers to come open before he throws or is he throwing them open?

    I like his ability to make decisions. He works the field, rarely forces the passes into super-tight windows and doesn’t take too many chances.

    A majority of his turnovers come on off-target throws or late throws. He generally does a good job processing the field, going through his progressions, manipulating the safety with his eyes, holding him to one side before going back to the other side of the field. That’s one of those things that’s hard to see as a fan unless you know to look for it, as scouts do.

    He doesn’t throw with anticipation a lot. You’ll see it a bit on comeback routes. I want to see it more. But his overall decision making, he’s at a good level, or a 6, for the NFL.

    Clutch Performance

    Our third critical factor is clutch performance

    • How do they play on 3rd and 4th downs?
    • How are they in the red zone in the final minutes when their team is trailing?
    • How do they handle playing on the road? In adverse conditions?

    Pickett had a lot of 4th-quarter comebacks at Pitt and drove the ball down the field and made the throws to put the ball in the end zone when needed. He’s a 6 clutch at the next level for me.

    Positional Factors

    There are 12 positional factors and we’re not going to go through all of them.

    But one of them is leadership. Leadership kind of goes back to clutch a little bit.

    How does he play in adverse situations?

    What’s his body language? Is he sort of dejected over on the sideline by himself when he or his team is struggling? Or is he a guy that’s trying to rally the troops?

    But also, it’s things like – is he standing in there and making plays while taking hits. Is he putting his body on the line to get an extra yard for the first down. There’s an extra value for us beyond the statistical value of the first down yardage.

    With Pickett, he’ll stand in and take hits if needed. His mobility allows him to gain yards with his feet and he usually seems willing to get the extra yard if he can. He gets a 6 from me for leadership.

    Another positional factor is footwork, which ties in to working the pocket and resetting his base as he’s about to make a throw. You’ve got to be able to maneuver the pocket and stay away from the pass rush.

    One thing that Pickett does really well and quickly is reset his base when he has the chance to, rather than throwing off one foot. Maybe he’ll see a receiver come open quicker than expected or at the last second, and instead of hurrying to throw from whatever position he’s in, he’s quick to reset his feet and get into the correct position to make an accurate throw.

    With all of that in mind, I liked what I saw from Pickett on both of these. I graded him a 6 in footwork. . Remember that there are 10 other positional factors to consider. His other grades were a range of 5s and 6s, though I gave him a 7 in eye discipline, which refers back to what I said about him looking off safeties.

    Overall

    So when we try to come up with an overall grade, we generally have a scale ranging from 5.4 to 9 and the decimals matter. The higher the better.

    For quarterbacks, a 5.4 to 6.2 are generally backups. A 6.3 to 6.9 are starters of varying degrees, with a 6.5 and 6.6 being a lower-end starter working up to 6.7 to 6.9, which are solid starters.

    The 7s and above are high-end players with the potential to be among the league’s elite players.

    Last year:

    Trevor Lawrence was a 7.2.

    Justin Fields and Zach Wilson were 6.9.

    Mac Jones and Trey Lance were 6.6.

    I think Pickett is more of a ‘win-with’ type of quarterback, who definitely has traits to play at the next level. I just don’t think he’s going to be that top-tier talent that you see coming out early in the first round.

    I have him at the 6.6 grade level for my final grade.

    You’ll be able to see the full report on our new NFL Draft website in a few weeks!

    And check out our Off The Charts episode in which John Todd & I broke down 3 other college football standouts in a similar manner.

  • Podcast Episode: Black Players and Coaches in Pro Football – Currently/Historically

    Podcast Episode: Black Players and Coaches in Pro Football – Currently/Historically

    On this episode of the Off The Charts Football Podcast, Mark Simon (@MarkASimonSays) and Matt Manocherian (@mattmano) are joined by American University law professor and author Jeremi Duru to discuss the state of the NFL as it relates to hiring Black coaches and front office members, and Pro Football Hall of Fame senior advisor Joe Horrigan to detail the history and origin story of the Black athlete in pro football.

    Jeremi talks about the Brian Flores case and the possible directions it might go, as well as what the league and teams are doing to try to increase hiring in different areas (). Joe talks about the early segregated NFL and how the color barrier was broken, as well as prominent players in Black football history, including Emlen Tunnel and Doug Williams ().

    Thanks for listening. You can email the show with feedback at offthecharts@ww2.sportsinfosolutions.com and don’t forget to follow on Twitter @SportsInfo_SIS and Instagram @sportsinfosolutions. For more, check out: sportsinfosolutions.com SISDataHub.com

  • Providing Sharp Football Analysis on the Super Bowl

    Providing Sharp Football Analysis on the Super Bowl

    Check out our Super Bowl coverage at Sharp Football Analysis.

    Corey March takes a look at 3 Super Bowl prop bet options in which the numbers indicate a favorable option.

    “Kupp, who has proven the ability to beat any number. He’s gone over 100 yards in 13-of-20 games, including 8-of-11 since the injury to Robert Woods, and posted a combined 325 yards over his last two games.

    Kupp will put his technical mastery on display against a Bengals secondary that is slightly below average according to Pass Coverage Points Saved (ranked 19th). Even more problematic for the Bengals is that their biggest weakness has been guarding the slot, ranking dead-last with 137 yards per game allowed to slot receivers.”

    READ

    Stephen Polacheck looks at the Rams and Bengals offenses and asks the question: Are these teams predictable in what they do?

    “When thinking about key moments, many third and fourth downs with short yardages come back as pivotal talking points following a game. The Bengals’ personnel choice in this situation tips their play selection. 11 personnel features a 26% rushing rate, and 12 personnel returns an 88% rushing rate. Compare this to the Rams offense, which uses 11 personnel on 91% of these snaps but has a passing rate of only 57%.” 


    READ

  • Answering The Key Super Bowl Questions

    Answering The Key Super Bowl Questions

    Let’s get right to it – trying to answer the most pressing questions to help enhance the viewing experience for Super Bowl Sunday – with our VP of Football Matt Manocherian, our Lead Football Analyst, Alex Vigderman, and Off the Charts producer, Justin Stine (who tracked every play of every Rams game this season).

    You can listen to our podcast at the link above or read their thoughts below.

    What’s the most important thing to be watching going into this game?

    Alex: How do the Rams defend Cincinnati’s weapons in the passing game?
    We know that the Bengals want to get the ball out quickly, because the biggest mismatch is the Bengals’ O-line against the Rams’ front.

    The Rams will have to account for the fact that the Bengals are much more evenly distributed talent-wise at receiver than they are in the defensive backfield (read Stephen Polacheck’s look at the Bengals’ receivers here).

    If we look at Points Above Average, which is the part of the guts of Total Points that evaluates each player relative to average performance, Jalen Ramsey is +24 points and the rest of the secondary is –30.

    The question is whether or not the non-Jalen-Ramsey players on the back end for the Rams can hold up in those first few seconds.

    Matt: How both teams deploy their safeties. Both of these teams want to play light boxes. Each of these teams are going to try to get the other out of this alignment so that they can throw the ball over the top to their superstar receivers.

    When you play two safeties deep, that allows you to almost double-team Ja’Marr Chase. Because you have the help over the top, the underneath defenders don’t have to account for as much space whether they’re playing man or zone.

    What I’m trying to get at is that you can alter the shape of the defense with the run game and when you do that, that can create different opportunities for you.

    What advantages can the Bengals exploit?

    Matt: Both are heavy outside zone teams. If game script allows, Joe Mixon and the Bengals running game is a potential advantage over the Rams. If they really want to get Ja’Marr Chase going, I think Mixon is a potential avenue for success.

     Alex: To that point, the Bengals ran stretch zone (outside the tackles) as much as anyone this year, and while they weren’t super-successful with it, they will be running away from the teeth of the Rams’ defense. The Rams are in the top 5 in EPA per attempt and top 10 in Positive% defending inside runs, and more middle-of-the-pack on runs outside the tackles.

     How might the Rams defense all of this?

    Justin: Don’t expect the gameplan to look the same as it did against the San Francisco 49ers in the NFC Championship game.

    The Rams have primarily played a two-high safety shell scheme throughout the season, but Defensive Coordinator Raheem Morris made an adjustment against the 49ers and switched to a single-high look to try to contain the San Francisco running game.

    The team primarily used Nick Scott as the deep man in this scheme, while Eric Weddle was utilized more in the slot and in the box. The Rams don’t often load the box in their normal scheme, but Weddle and even nickel cornerback David Long spent more time near the line of scrimmage against the 49ers than any other game this season.

    Don’t expect the Rams to repeat that strategy against the Bengals, as they will likely move back to their two-high, softer-zone scheme and look to exploit of what appears to be an advantage with their defensive line vs. the Cincinnati offensive line.

    If they aren’t able to get the Rams out of that look, it could be a long day for Burrow and his offensive line, given that they’re dealing with a pass-rush that features the likes of Aaron Donald, Von Miller, and Leonard Floyd.

    How can the Rams overpower the Bengals?

    Matt: Overpower them with star power.

    Alex: The Rams have seven players who rank in the Top 5 at their respective positions in Total Points (Aaron Donald, Cooper Kupp, Jalen Ramsey, Andrew Whitworth, David Edwards, Leonard Floyd, and Matt Gay). The Bengals have one.

     Matt: And the Bengals interior offensive line is no match for Aaron Donald. They’ve even been rotating some players in there. He is better at his position than any player is at their position in the NFL, and he is a problem in both phases.

    Is there anything about the Rams that would concern you going into this game?

    Alex: We love questioning coaching decisions around fourth downs, and the Rams present an interesting opportunity for that. They’ve been more field-goal-heavy than we’d recommend when in close, and they’ve forgone punts for conversion attempts more than the typical team when they’re outside the 30. So they’re walking a fine line between making the nerds or jocks angry.

    Matt: I like living in a place where I make both the nerds and jocks angry frequently.

    For me, it’s the health question. Everybody from Whitworth to Ramsey seems dinged up for the Rams. Not to mention Robert Woods, who is really important to their pass and run games. Though on the other hand, Darrel Henderson could be an x-factor for them if he can play.

    Let’s talk up one unsung star on each team who could be vital on Sunday. With the Bengals, how about cornerback Chidobe Awuzie, who on a per-play basis ranks comparably in value to Jalen Ramsey?

    Alex: Awuzie didn’t make a lot of noise this year but he was solid. He wasn’t exclusively an outside corner but he did much better out there. He allowed just under a quarter of his targets to go for positive EPA when lined up outside.

    He was definitely getting beat a bit, but he was able to catch up and limit the damage. Put another way, he had the sixth-most intended air yards in his direction this season, but he yielded the 59th-most yards.

    One way he could impact the game in a negative way is getting beat over the top when they’re in zone. He was targeted more than any other player on throws 20+ yards downfield in zone coverage in the regular season, and he’s allowed 137 yards and a touchdown on five such targets in the playoffs.

    And from the Rams, that would be linebacker Leonard Floyd?

    Alex: Floyd is a perfect example of the interactive nature of pass rush. If you look at what we might call “cleanup sacks,” where one player hurries the quarterback and the other gets the sack, Floyd trails only TJ Watt the last two years with 10 of them.

    Having multiple threats up front makes a huge difference.

    Another example of this is that he had four sacks this year when he went unblocked. Having pass rush threats both inside and outside makes things hard for the offense, and sometimes that’s what comes of it. Adding Von Miller makes it even more difficult because you can hit from both sides, and Floyd’s really taken advantage. 

    Matt, let’s end on this – You’ve said Joe Burrow is a QB you can win a Super Bowl with, but not yet one you can win a Super Bowl ‘because of.’ What’s the missing piece there?

     His accuracy is awesome, and the numbers really illuminate that. And I don’t fault him for the sacks. I actually think he does a great job of avoiding them and playing with limited protection.

    But look at the off-platform throws.

    There were a couple of dropped interceptions in the AFC championship game that would really change the narrative on him right now, and I do think that every once in a while you see his inconsistent arm talent show up.

    So, for me, to be ‘win because of’ without an elite arm would require Drew Brees-like precision, which he is trending towards but I’m not quite ready to crown him with quite yet.

     Enjoy the game!

  • Stat of the Week: The Super Bowl is Super-Hard To Predict

    Stat of the Week: The Super Bowl is Super-Hard To Predict

    By MARK SIMON

    It was tradition in this space for John Dewan to devise a Super Bowl prediction system using a variety of statistical categories to pick the winner during Super Bowl week.

    So we’ve tried to find a way to modernize that.

    We’ve got Total Points, our player value stat, back to 2016, and can tell you which players and teams rank best in Points Earned or Points Saved per play for Passing, Rushing, Receiving, Blocking, Pass Rush, Pass Defense, and Run Defense combining the regular season and postseason.

    We have data on the last five Super Bowls:

    In those five games, the team with more advantages (by ranking) over its opponent in the core areas we just mentioned has only won twice.

    The 2020 Buccaneers, who had more Blocking Points Earned Per Play and more Points Saved Per Play in all three defensive facets (Pass Rush, Pass Coverage, Run Defense) last season were one of those teams. The 2017 Eagles, who beat the Patriots in the Super Bowl, were the other.

    The 2016 Patriots had three advantages among the seven stat categories but came from behind to beat the Falcons.

    The 2018 Patriots and 2019 Chiefs both had advantages in only two areas of Points Earned/Saved Per Play. The Patriots’ were in Passing and Blocking against the Rams. The Chiefs’ were in Passing and Receiving against the 49ers. But they were still able to win the Super Bowl.

    And there’s no clearly predictive element among these particular stats either.

    The team with better Blocking Points Earned Per Play has won three of the last five Super Bowls. The team with more Pass Coverage Points Saved Per Play has won three of the last five as well. And so has the team with more Run Defense Points Saved Per Play.

    One oddity to come from all of this. The team with fewer Rushing Points Earned has won four of the last five Super Bowls. And the team with fewer Receiving Points Earned has also won four of the last five.

    All that said, this game has something that the other five did not. The Rams have edges in six of the seven statistical categories. The only area in which the Bengals perform better than the Rams is in Rushing Points Earned Per Play.

    Bottom line: Total Points is a good stat. But this is one game and the Super Bowl is super-hard to predict, whichever system you use. Enjoy watching it!

    Last 5 Super Bowls

    Category
    (Points Earned/Saved Per Play)
    Trend* 2022 Team
    With Advantage
    Passing Won 2 of 5 Rams
    Rushing Won 1 of 5 Bengals
    Receiving Won 1 of 5 Rams
    Blocking Won 3 of 5 Rams
    Pass Rush Won 2 of 5 Rams
    Pass Defense Won 3 of 5 Rams
    Run Defense Won 3 of 5 Rams


    * Read as: “Team with more (category) has won X of the last 5 Super Bowls.”

    P.S: If you’re curious what John Dewan’s old system projects, it has the Rams ahead in 8 of 12 statistical categories (though the two teams barely differ in most of them). The Bengals are ahead in 3 and the teams are even in another.

    P.P.S.: If you’re into Super Bowl predictions related to player performance and team trends, check out Corey March and Stephen Polacheck’s articles on Sharp Football Analysis later this week.

    And check out The Off The Charts Football Podcast for plenty of Super Bowl talk.

  • From Heinicke to Brady: Joe Burrow’s Climb Up the QB Rankings

    From Heinicke to Brady: Joe Burrow’s Climb Up the QB Rankings

    In a Week 2 loss to the Bears, Joe Burrow threw three interceptions and was sacked five times.

    That dropped him nine spots in our World’s No. 1 QB Rankings. After that game, Burrow ranked 33rd. For perspective, at that moment he was eight spots behind Washington QB Taylor Heinicke. Heinicke and Burrow basically changed places in Week 2. Burrow went from 24 to 33. Heinicke went from 34 to 25 after beating the Giants.

    Flash forward five months and Burrow now ranks No. 7.

    And for what it’s worth, Heinicke ranks third-to-last, ahead of only Ben Roethlisberger and Mike Glennon.

    But we’re here to focus on the Super Bowl QB.

    A reminder that The World’s No. 1 Quarterback Ranking is based on a model devised by Bill James to evaluate The World’s No. 1 Starting Pitcher. Bill’s model was based on cumulative evaluation of individual starts over an extended time using the metric Game Score.

    The World’s No. 1 Quarterback Ranking uses our player value stat Total Points to make a cumulative evaluation of game performance over a three-year period. The key to our calculation is Points Above Average (PAA), which is the statistical underpinning of Total Points that is centered at zero so that positive numbers are above average and negative numbers are below average.

    Success over time is key to maintaining a good ranking. Prolonged inactivity results in a ranking drop. The most recent performances carry the most weight.

    That last sentence is Burrow’s season story. He ranked as low as No. 33 as we noted. After a six-sack, two-pick game against the Chargers in Week 13, he ranked No. 21, two spots behind Jimmy Garoppolo and 15 places behind Kirk Cousins, of whom he now sits one spot ahead.


    Here’s the current Top 10.

    1. Patrick Mahomes
    2. Justin Herbert
    3. Aaron Rodgers
    4. Josh Allen
    5. Tom Brady
    6. Matthew Stafford
    7. Joe Burrow
    8. Kirk Cousins
    9. Derek Carr
    10. Kyler Murray

    Since Week 14, which was actually a loss to the 49ers, Burrow has played at a different level, with 15 touchdown passes, 2 interceptions, and ranks top-two in completion percentage, catchable pass percentage, and on-target percentage (including the postseason).

    But maybe we could have seen this coming. Even in Weeks 1-13, when Burrow had 23 TD passes and 14 interceptions, Burrow led the NFL in catchable pass percentage (89%) and was 2nd in on-target percentage (83%).

    Burrow’s on-target percentage was actually one percentage point better in Weeks 1-13 than it has been from Week 14 to now.

    Where Burrow’s growth has come that has led to his jump up the rankings is in his play when pressured. Yes, he’s still taking his fair share of sacks (remember the nine times he went down against the Titans), but when he’s able to get the ball out, he’s done much more damage relative to what he was doing earlier in the season. He’s looked to shorter passes for greater success.

    Case in point against the Chiefs, where he was 9-of-14 for 120 yards and a touchdown, including two key first-down completions to Tee Higgins on the drive at the end of the first half that cut KC’s lead to 21-10

    Burrow When Pressured in 2021

    Weeks 1-13 Since Week 14
    Catchable Pass % 78% 90%
    TD-INT 4-6 4-0
    Sack % 27% 25%
    ADOT 12.1 yds 7.5 yds

    The Rams’ pressure will be a different kind of pressure than any Burrow has seen this season.

    Los Angeles ranks first in the NFL in Pass Coverage Points Saved Per Play.  Including the postseason, they have allowed only 3 touchdown passes and recorded 11 interceptions when pressuring opposing quarterbacks (the rest of the NFL has allowed 236 TD and recorded 168 interceptions when pressuring a QB).

    But hey, if you want to win a Super Bowl and keep climbing the World’s No. 1 QB Rankings, you’re going to have to get past the biggest obstacle in your way at some point.

    Here’s the full set of rankings.

    Rk Player PAA Per 60 Plays LastRk StartOfSeasonRank
    1 Patrick Mahomes 6.2 1 2
    2 Justin Herbert 6.2 2 10
    3 Aaron Rodgers 6.1 3 1
    4 Josh Allen 5.8 4 6
    5 Tom Brady 5.3 5 3
    6 Matthew Stafford 3.7 6 14
    7 Joe Burrow 3.1 7 22
    8 Kirk Cousins 2.4 8 9
    9 Derek Carr 2.0 9 7
    10 Kyler Murray 1.7 10 15
    11 Russell Wilson 1.5 11 5
    12 Lamar Jackson 0.9 12 12
    13 Teddy Bridgewater 0.8 13 18
    14 Ryan Tannehill 0.8 14 8
    15 Dak Prescott 0.7 15 17
    16 Mac Jones 0.6 16 N/A
    17 Matt Ryan -0.1 17 11
    18 Carson Wentz -0.5 19 81
    19 Taysom Hill -0.7 20 20
    20 Jimmy Garoppolo -0.7 18 25
    21 Jameis Winston -0.9 21 55
    22 Jacoby Brissett -1.1 22 21
    23 Josh Johnson -1.3 23 49
    24 Jalen Hurts -1.4 24 70
    25 Tua Tagovailoa -1.4 25 50
    26 Ryan Fitzpatrick -1.9 26 16
    27 Trevor Siemian -1.9 27 N/A
    28 Gardner Minshew -2.0 28 32
    29 Colt McCoy -2.2 29 51
    30 Jared Goff -2.2 30 31
    31 Tyrod Taylor -2.3 31 56
    32 Kyle Allen -2.3 33 34
    33 Chad Henne -2.3 32 29
    34 John Wolford -2.4 34 24
    35 Case Keenum -2.5 35 60
    36 Marcus Mariota -2.5 36 27
    37 Mason Rudolph -2.5 37 26
    38 Geno Smith -2.5 38 N/A
    39 C.J. Beathard -2.6 39 30
    40 Blaine Gabbert -2.6 40 36
    41 Brett Hundley -2.7 41 35
    42 Matt Barkley -2.7 42 48
    43 Chase Daniel -2.7 43 39
    44 Nick Mullens -2.7 44 72
    45 Nate Sudfeld -2.7 45 52
    46 Josh Rosen -2.7 46 58
    47 Brian Hoyer -2.7 47 59
    48 David Blough -2.8 48 61
    49 Joe Flacco -2.9 51 63
    50 Zach Wilson -2.9 50 N/A
    51 Drew Lock -2.9 49 23
    52 Will Grier -2.9 52 69
    53 Mike White -2.9 53 N/A
    54 Brett Rypien -2.9 54 65
    55 Jarrett Stidham -2.9 55 66
    56 Jordan Love -3.0 56 N/A
    57 Tyler Huntley -3.1 57 57
    58 Sean Mannion -3.1 58 45
    59 Garrett Gilbert -3.1 59 54
    60 Nick Foles -3.1 60 76
    61 Cooper Rush -3.2 61 N/A
    62 Ian Book -3.2 62 N/A
    63 Daniel Jones -3.2 63 71
    64 Baker Mayfield -3.3 64 13
    65 Dwayne Haskins -3.3 65 78
    66 Chris Streveler -3.3 66 62
    67 Trevor Lawrence -3.4 67 N/A
    68 Trey Lance -3.4 69 N/A
    69 Jake Luton -3.4 68 79
    70 Mitchell Trubisky -3.5 70 80
    71 Brandon Allen -3.7 72 75
    72 Phillip Walker -3.7 71 67
    73 Tim Boyle -3.7 73 N/A
    74 Justin Fields -3.8 74 N/A
    75 Cam Newton -3.8 75 19
    76 Jake Fromm -4.0 76 N/A
    77 Andy Dalton -4.1 77 46
    78 Davis Mills -4.8 78 N/A
    79 Sam Darnold -5.2 79 82
    80 Taylor Heinicke -5.5 80 28
    81 Ben Roethlisberger -6.5 81 53
    82 Mike Glennon -6.8 82 73